Fig. 4
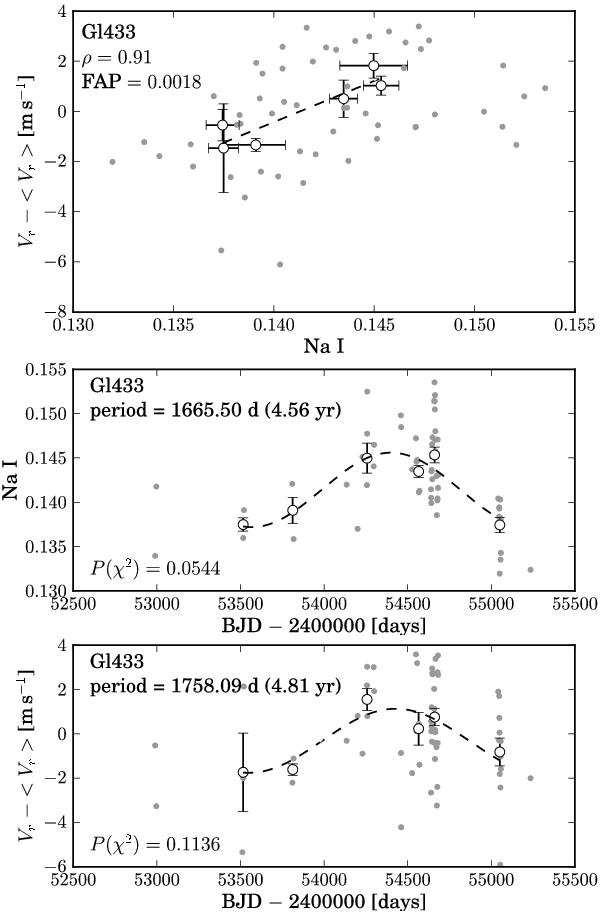
Top: RV relation with Na i index for Gl 433. Middle: sinusoidal fit to the Na i index for Gl 433. Bottom: sinusoidal fit to RV of Gl 433. Small dots without errorbars are nightly averaged and points with errorbars are averaged over 150 days. The dashed lines represent the best linear (top) and sinusoidal (middle, bottom) fits to the data.
Current usage metrics show cumulative count of Article Views (full-text article views including HTML views, PDF and ePub downloads, according to the available data) and Abstracts Views on Vision4Press platform.
Data correspond to usage on the plateform after 2015. The current usage metrics is available 48-96 hours after online publication and is updated daily on week days.
Initial download of the metrics may take a while.