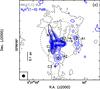
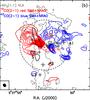
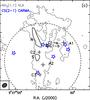
Fig. 6
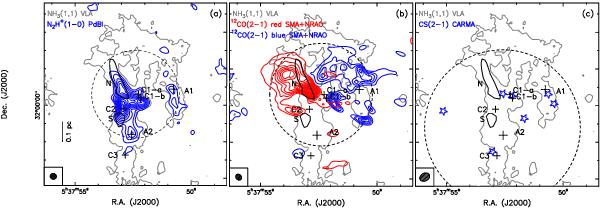
Overlay between the NH3 (1, 1) integrated emission (grey contour, same level as in Figs. 4 and 5), and the integrated emission of three previously observed tracers. They are, from left to right: a) the main group of hyperfine components of N2H+ (1−0) observed with the PdBI (Paper I, blue contours. First level and step = 0.02 Jy beam-1); b) the 12CO integrated emission over the red and blue non-Gaussian wings derived from SMA + NRAO merged data (same contours as in Paper II); c) the CS (2−1) line emission peaks detected with CARMA (Lee et al. 2011, peak positions are taken from their Table 1). In each panel, black contours indicate the 3σ rms contour level of the N2D+ (3−2) emission, and crosses mark the peak position of the 3 mm continuum sources and of the ammonia cores as in Figs. 1 and 3. The ellipse in the bottom left corner and the dashed circle represent the synthesised beam and the primary beam, respectively, of the instrument used to observe the tracer superimposed on the ammonia emission: PdBI (left panel); SMA + NRAO (middle panel); CARMA (right panel).
Current usage metrics show cumulative count of Article Views (full-text article views including HTML views, PDF and ePub downloads, according to the available data) and Abstracts Views on Vision4Press platform.
Data correspond to usage on the plateform after 2015. The current usage metrics is available 48-96 hours after online publication and is updated daily on week days.
Initial download of the metrics may take a while.