Fig. A.1
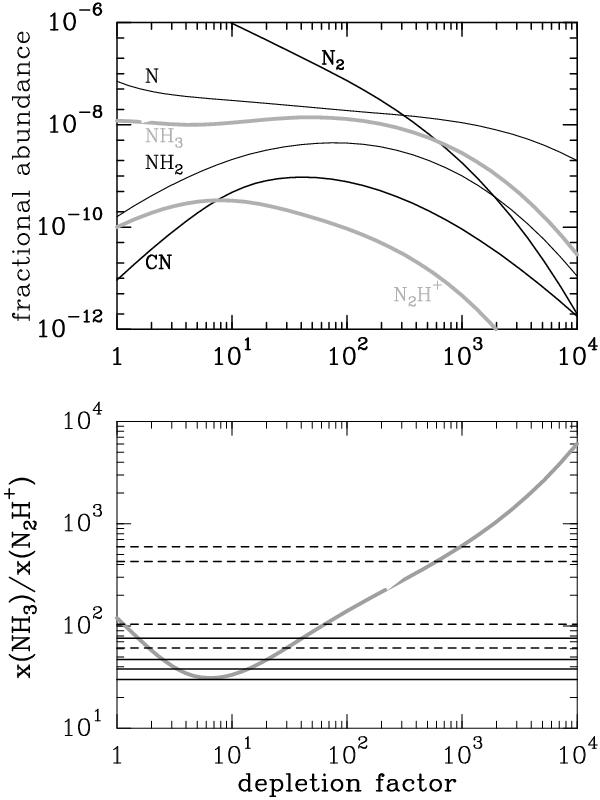
Top panel: fractional abundance of selected species as a function of depletion factor (see text for details). Note the sharp drop of N2 and the shallower drop of NH3 compared to N2H+. Bottom panel: NH3/N2H+ abundance ratio as a funciton of depletion factor. Horizontal lines are the observed values (see Table 3) for protostellar (continuous) and starless (dashed) cores. Note that although all protostellar cores are consistent with both low and large values of freeze-out, two of the starless cores can only be reproduce by values of depletion factor around 1000, similar to what measured in the core nucleus of L1544 (Caselli et al. 1999).
Current usage metrics show cumulative count of Article Views (full-text article views including HTML views, PDF and ePub downloads, according to the available data) and Abstracts Views on Vision4Press platform.
Data correspond to usage on the plateform after 2015. The current usage metrics is available 48-96 hours after online publication and is updated daily on week days.
Initial download of the metrics may take a while.