Free Access
Fig. 2
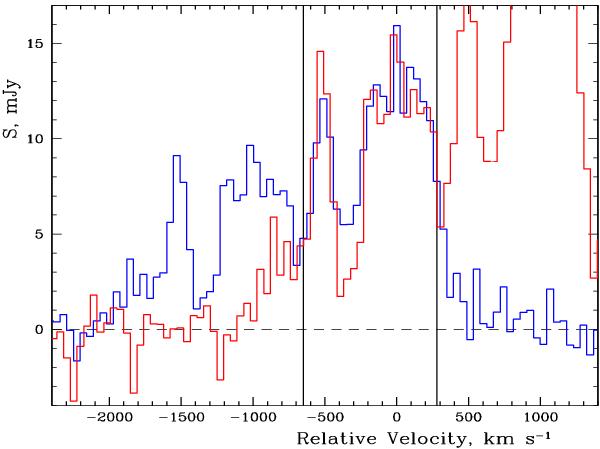
Same as Fig. 1, but the original spectrum is shifted to +999.8 km s-1 (red color histogram) and its intensity is zoomed by a factor 1.6 to be comparable with the CO(7–6) spectrum within the window marked by two vertical lines. This window is used in the bootstrap calculations.
Current usage metrics show cumulative count of Article Views (full-text article views including HTML views, PDF and ePub downloads, according to the available data) and Abstracts Views on Vision4Press platform.
Data correspond to usage on the plateform after 2015. The current usage metrics is available 48-96 hours after online publication and is updated daily on week days.
Initial download of the metrics may take a while.