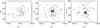
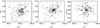
Fig. 10

Two of the most Gaussian clusters in our sample. Upper row: the cluster 58604. Lower row: the cluster 60539. From left to right: the DS test bubble plot (symbol sizes are proportional to the eδ), and RA vs. Dec, and RA vs. velocity (in 102 km s-1) plots; the symbols show different components as found by Mclust. The star marks the location of the main galaxy.
Current usage metrics show cumulative count of Article Views (full-text article views including HTML views, PDF and ePub downloads, according to the available data) and Abstracts Views on Vision4Press platform.
Data correspond to usage on the plateform after 2015. The current usage metrics is available 48-96 hours after online publication and is updated daily on week days.
Initial download of the metrics may take a while.