Fig. 5
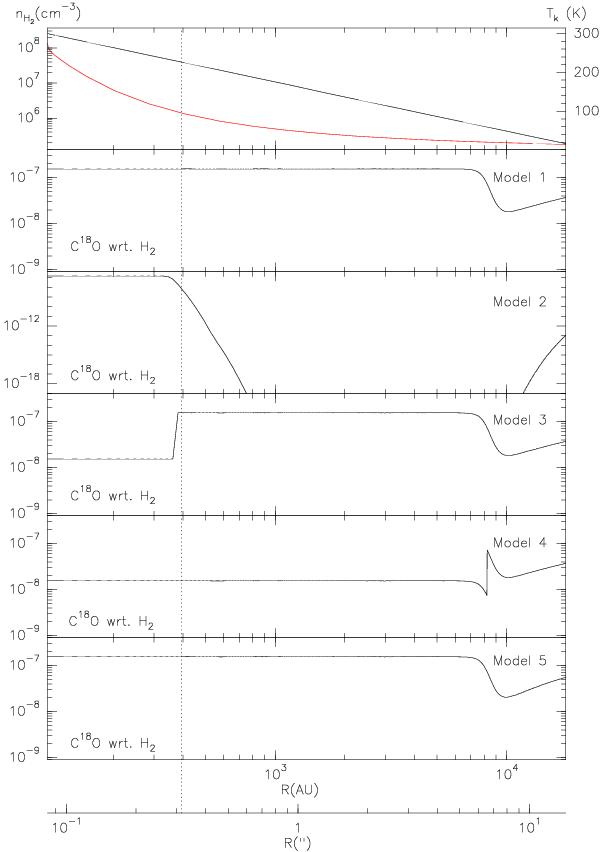
In the upper panel we show the density (black) and temperature (red) profiles (Crimier et al. 2010) used as the physical basis for our chemical model. Below, we show the abundance profile of C18O predicted by the chemical models in Table 2. The spatial and angular scales are shown. This size of the hot core is indicated by a dashed line.
Current usage metrics show cumulative count of Article Views (full-text article views including HTML views, PDF and ePub downloads, according to the available data) and Abstracts Views on Vision4Press platform.
Data correspond to usage on the plateform after 2015. The current usage metrics is available 48-96 hours after online publication and is updated daily on week days.
Initial download of the metrics may take a while.