Fig. 2
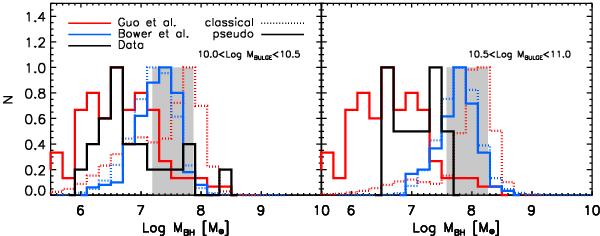
Black hole mass distributions for galaxies with bulge masses 10 < log Mbulge < 10.5 (left panel) and 10.5 < log Mbulge < 11 (right panel) predicted by the Guo et al. (2011) and Bower et al. (2006) models (red and blue lines, respectively), and for classical and pseudo bulges (dotted and solid lines, respectively). The solid, black lines in both panels are the data collected in Table 1. The grey stripes are the black hole mass intervals (median plus scatter) inferred from the Sani et al. Mbh-Mbulge relation for the corresponding bulge masses.
Current usage metrics show cumulative count of Article Views (full-text article views including HTML views, PDF and ePub downloads, according to the available data) and Abstracts Views on Vision4Press platform.
Data correspond to usage on the plateform after 2015. The current usage metrics is available 48-96 hours after online publication and is updated daily on week days.
Initial download of the metrics may take a while.