Fig. 1
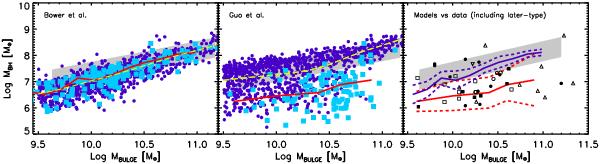
Left panel: the dark blue circles show the distribution of black holes for a sample of 1000 black holes randomly selected from the Bower et al. (2006) catalogue. The cyan squares are a random sample of 100 black holes with their hosts’ bulges mainly grown via secular processes (“pseudobulges”). The long-dashed yellow and red black lines are the median Mbh-Mbulge relations competing to the former and the latter samples, respectively; the grey stripe indicates the local empirical Mbh-Mbulge relation for classical bulges from Sani et al. (2011). Middle panel: same pattern as the left panel but with both samples extracted from the Guo et al. (2011) catalog, with the long-dashed yellow and red solid lines being the respective median Mbh-Mbulge relations for the two samples. Right panel: comparison between predicted the distributions of pseudobulges of Bower et al. (2006) and Guo et al. (2011; blue and red lines, respectively), with their 1-σ uncertainties (dashed lines) compared to data (Table 1) from Hu (2012, filled squares, Kormendy et al. (2011, filled circles, Mathur et al. (2012, open circles, Orban de Xivry et al. (2011, open squares, Woo et al. (2010, upside down triangle, and Mathur et al. (2001, filled star. Also shown for completeness data on pseudobulges by Sani et al. (2011, open triangles. The average error in BH masses for active and inactive galaxies is of the order of ~0.3 dex. Of similar magnitude is the propagated error on stellar masses at fixed galaxy colour.
Current usage metrics show cumulative count of Article Views (full-text article views including HTML views, PDF and ePub downloads, according to the available data) and Abstracts Views on Vision4Press platform.
Data correspond to usage on the plateform after 2015. The current usage metrics is available 48-96 hours after online publication and is updated daily on week days.
Initial download of the metrics may take a while.