Fig. 8
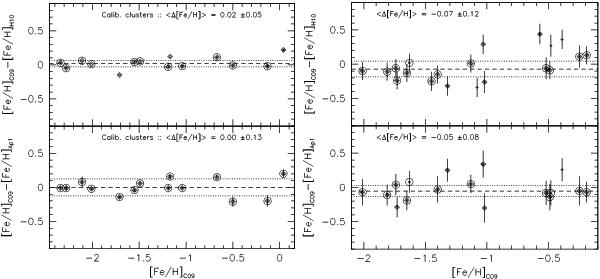
Differences in metallicity between our determinations and those of the literature are plotted here against [Fe/H] values computed in this work. In the upper panels the comparison metallicities are those of H10, while in the lower panels they are those of Appendix 1 of C09. The dashed and dotted lines represent the average and ± σ of the metallicity differences, which were computed after retaining clusters with deviations smaller than 1 × σ from a preliminary fit (encircled single or double diamonds). The left panels show the 14 calibration clusters, and the right panels show the 20 program clusters (17 for the comparison with C09/Appendix 1, see Table 6). In the right panels single diamonds represent clusters with weight smaller than 3 in H10. Error bars in the lower panels represent the quadratic sum of our errors and those of C09.
Current usage metrics show cumulative count of Article Views (full-text article views including HTML views, PDF and ePub downloads, according to the available data) and Abstracts Views on Vision4Press platform.
Data correspond to usage on the plateform after 2015. The current usage metrics is available 48-96 hours after online publication and is updated daily on week days.
Initial download of the metrics may take a while.