Fig. 6
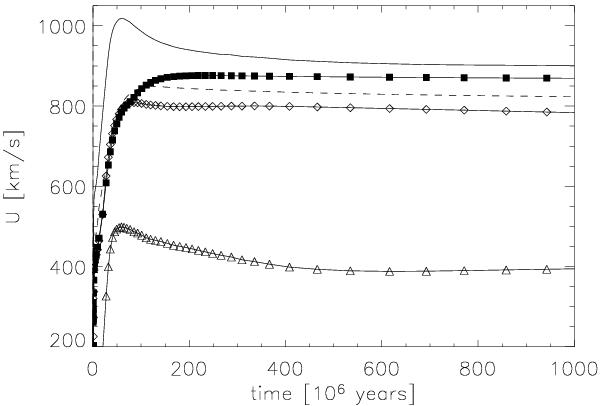
The various velocities occurring in the time-dependent solutions also plotted in Fig. 5 as a function of time. All velocities are given in the rest frame of the galaxy. The solid line depicts the velocity of the forward shock vs and the dashed line the reverse shock vr. The highest gas velocity (filled squares) gives the upstream velocity of the reverse shock v2. The open triangles plot the post shock velocity v1 of the reverse shock. The open diamonds correspond to the gas velocity v0 three diffusive scales  in front of the forward shock. In less than about 7 × 10⁷ years or r < 50 kpc, all the velocities become constant and are also given in Table 1.
Current usage metrics show cumulative count of Article Views (full-text article views including HTML views, PDF and ePub downloads, according to the available data) and Abstracts Views on Vision4Press platform.
Data correspond to usage on the plateform after 2015. The current usage metrics is available 48-96 hours after online publication and is updated daily on week days.
Initial download of the metrics may take a while.