Fig. 17
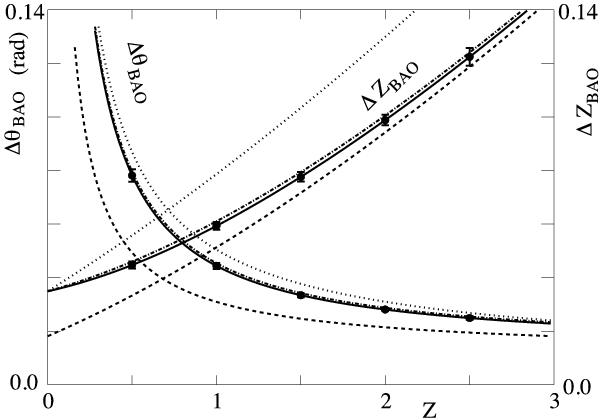
The two “Hubble diagrams” for BAO experiments. The four falling curves give the angular size of the acoustic horizon (left scale) and the four rising curves give the redshift interval of the acoustic horizon (right scale). The solid lines are for (ΩM,ΩΛ,w) = (0.27,0.73, −1), the dashed for (1,0, −1) the dotted for (0.27,0, −1), and the dash-dotted for (0.27,0.73, −0.9), The error bars on the solid curve correspond to the four-month run (packed array) of Table 7.
Current usage metrics show cumulative count of Article Views (full-text article views including HTML views, PDF and ePub downloads, according to the available data) and Abstracts Views on Vision4Press platform.
Data correspond to usage on the plateform after 2015. The current usage metrics is available 48-96 hours after online publication and is updated daily on week days.
Initial download of the metrics may take a while.