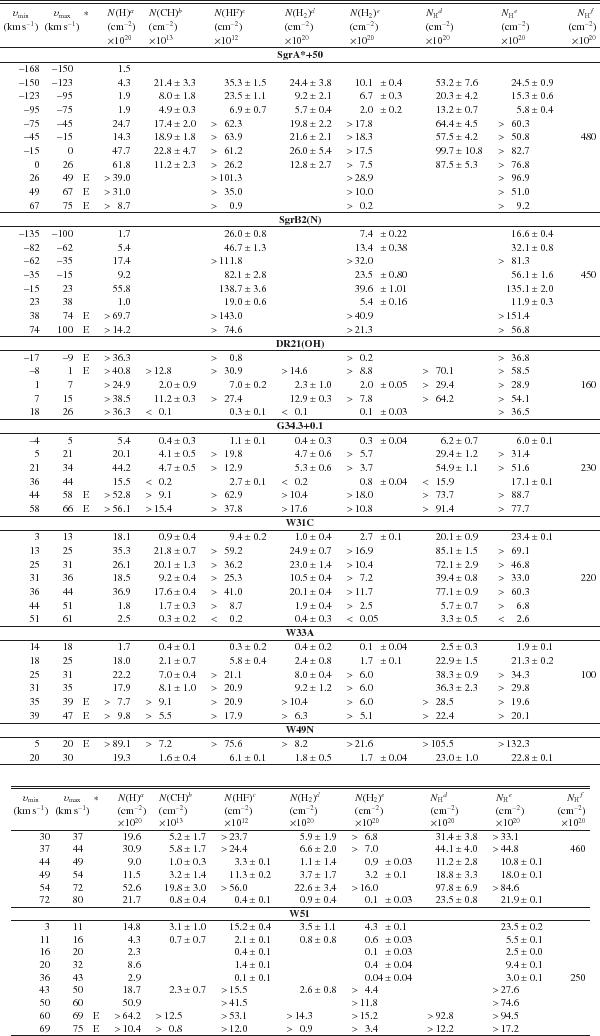
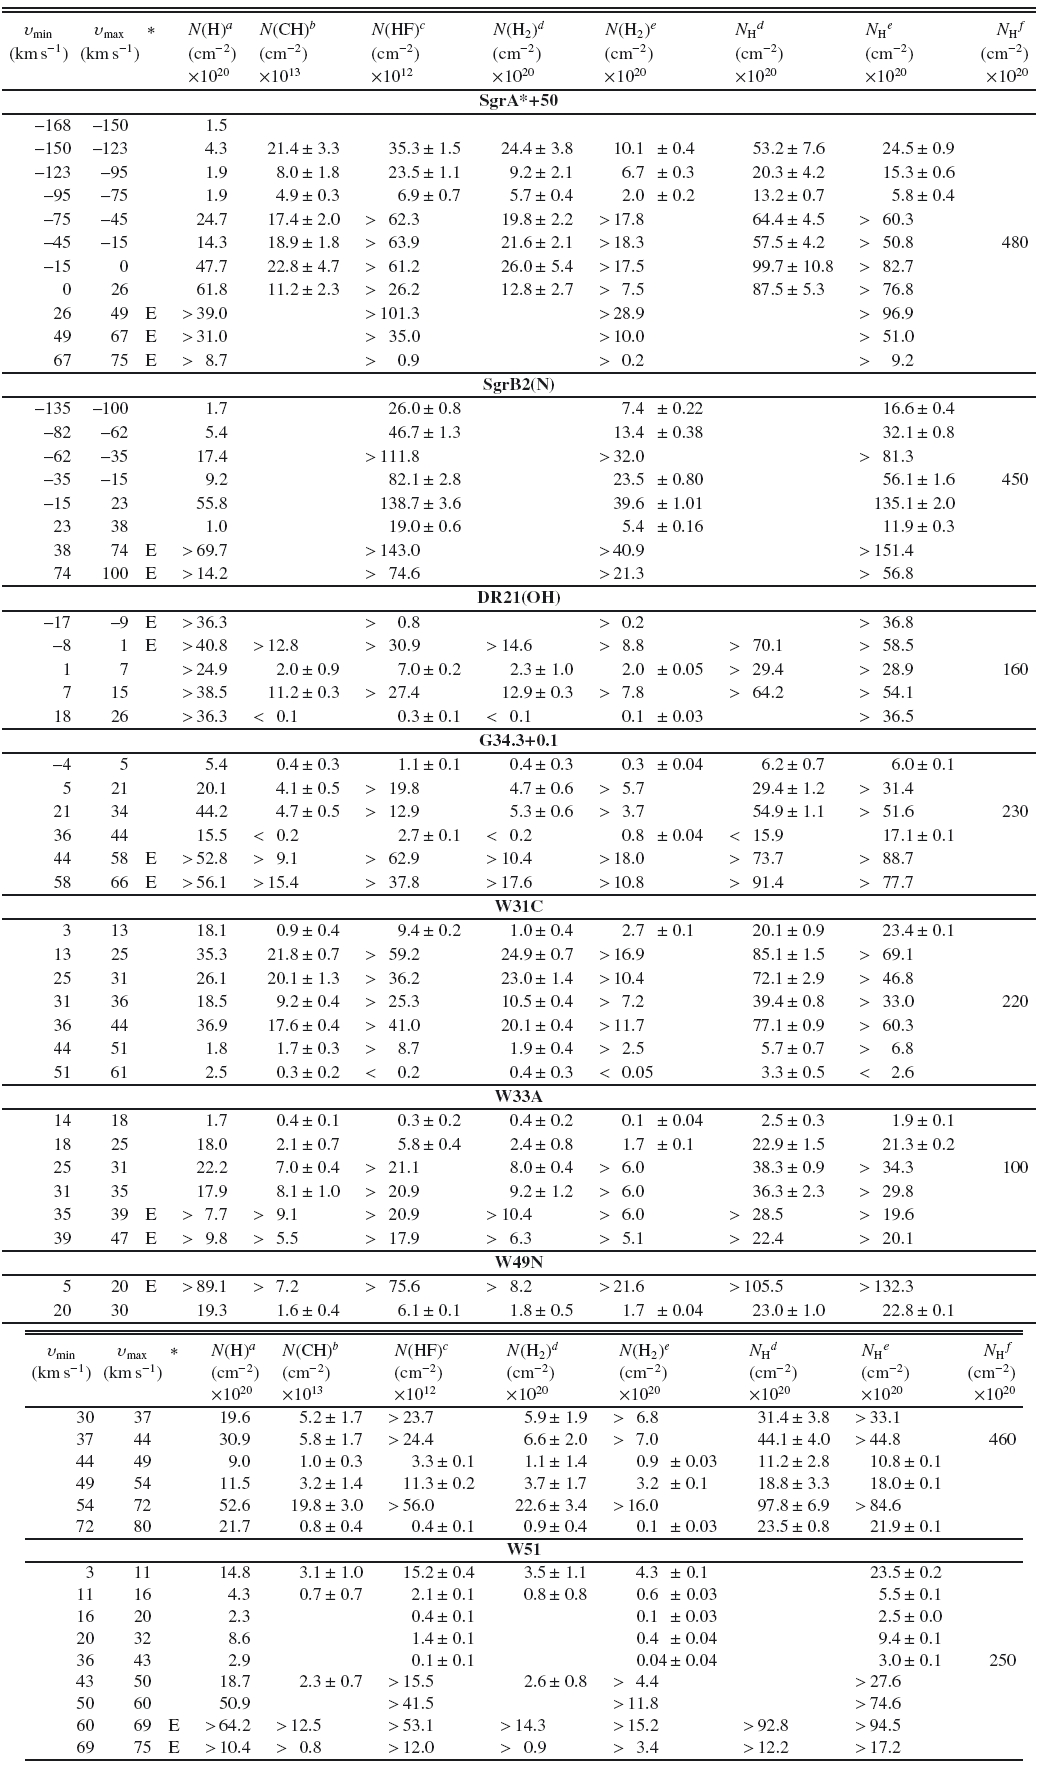
Table 4
HI, H2, and total hydrogen column densities per velocity interval.
Notes. (∗) E = absorption line profile observed in the star-forming region; Tex may be underestimated, hence the lower limit on N(HF), and N(CH). (a) From the observations with the VLA interferometer by Koo (1997), Fish et al. (2003), Pandian et al. (2008), Dwarakanath et al. (2004), and Lang et al. (2010) assuming a spin temperature of 100 K. (b) From (Gerin et al. 2010b; Gerin et al., in prep.). (c) From (Neufeld et al. 2010b; Sonnentrucker et al. 2010; Neufeld et al., in prep.; Sonnentrucker et al., in prep.). (d) Estimate from the observation of the CH absorption lines, a mean value of the HF/CH column density ratio of 0.4 (inferred from Cols. 5 and 6) and an abundance ratio n(HF)/n(H2) = 3.6 × 10⁻⁸, as predicted by UV-dominated chemical models (see Appendix C). (e) Estimate from the observation of the HF absorption lines and an abundance ratio n(HF)/n(H2) = 3.6 × 10⁻⁸, as predicted by UV-dominated chemical models (see Appendix C). (f) Estimate of NH integrated over the entire line of sight from models of the extinction at 2 μm by Marshall et al. (2006). In the last column, the total hydrogen column densities are estimated over the entire sight line.
Current usage metrics show cumulative count of Article Views (full-text article views including HTML views, PDF and ePub downloads, according to the available data) and Abstracts Views on Vision4Press platform.
Data correspond to usage on the plateform after 2015. The current usage metrics is available 48-96 hours after online publication and is updated daily on week days.
Initial download of the metrics may take a while.