Table 3
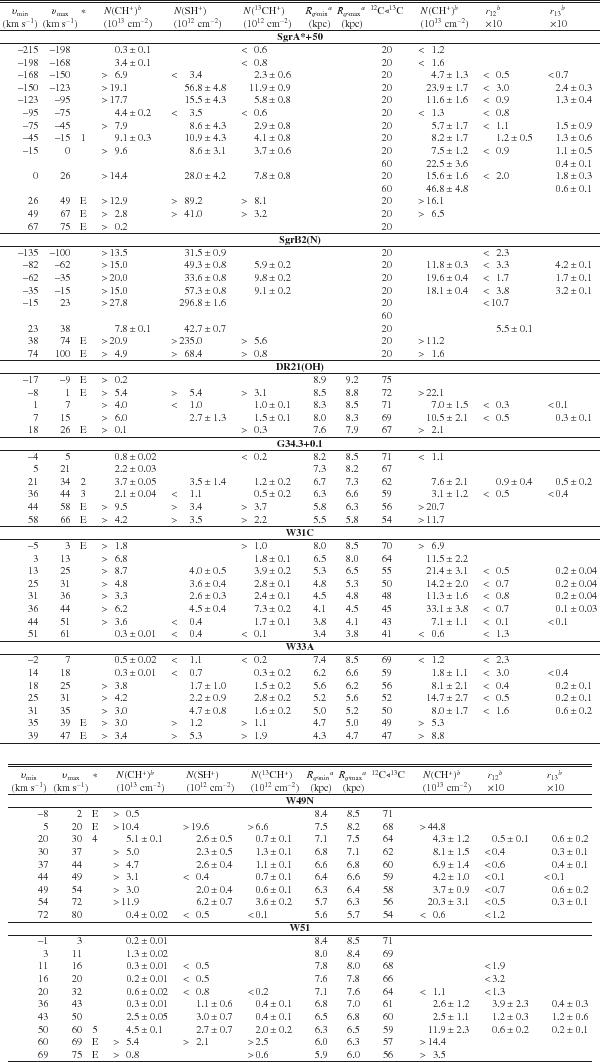
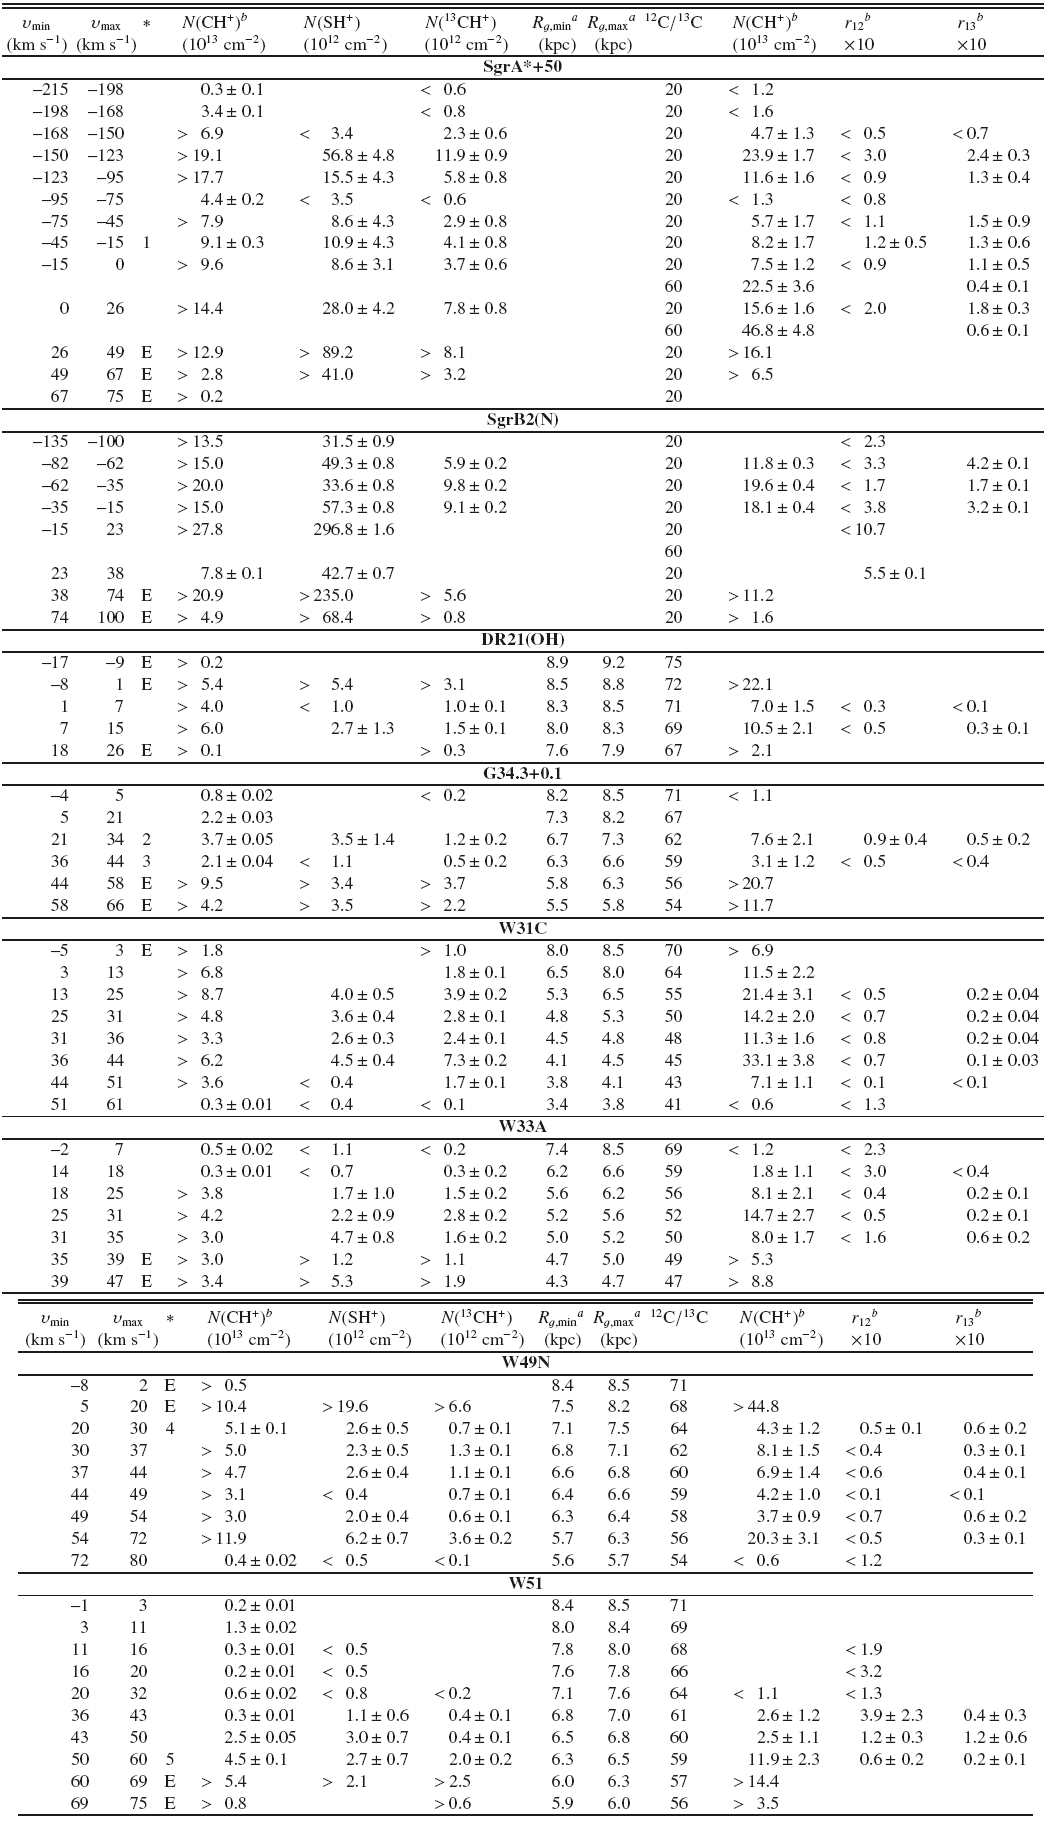
Comparison between the column densities of CH+, 13CH+, and SH+obtained with the integrations of the respective opacities over several velocity intervals.
Notes. (∗) E = absorption line profile observed in the star-forming region; Tex may be underestimated, hence the lower limit on N(CH+), N(13CH+), and N(SH+). 1,2,3,4,5 = velocity intervals where 12CH+ and 13CH+ are observed simultaneously with a 3σ detection level. (a) Galactocentric distances derived as 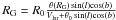 with R0 = 8.5 kpc and θ0 = 220 km s-1 as recommended by the IAU (Kerr & Lynden-Bell 1986), and assuming a flat Galactic rotation curve (θ(RG) = θ0). (b) Towards SgrA*+50 and SgrB2(N), when the comparison is possible, N(CH+) derived from 12CH+ and 13CH+ and the ratios r12 and r13 agree within the combination of their respective errors and the uncertainty of 50% on the 12C/13C ratio (see main text). The two last columns contain the ratios r12 = N(SH+)/N(CH+) and r13 = N(SH+)/N(13CH+) × 13C/12C. In Col. 10, CH+ column densities are inferred from those of 13CH+ and the 12C/13C Galactic gradient derived by Milam et al. (2005): N(CH+) = N(13CH+) × 12C/13C. The blank spaces correspond to unusable 13CH+ or SH+ data owing to the contamination of an emission line from the SFRs, or because the spectrum measured over the associated velocity interval could not be deconvolved from the SH+ hyperfine structure.
Current usage metrics show cumulative count of Article Views (full-text article views including HTML views, PDF and ePub downloads, according to the available data) and Abstracts Views on Vision4Press platform.
Data correspond to usage on the plateform after 2015. The current usage metrics is available 48-96 hours after online publication and is updated daily on week days.
Initial download of the metrics may take a while.