Fig. 6
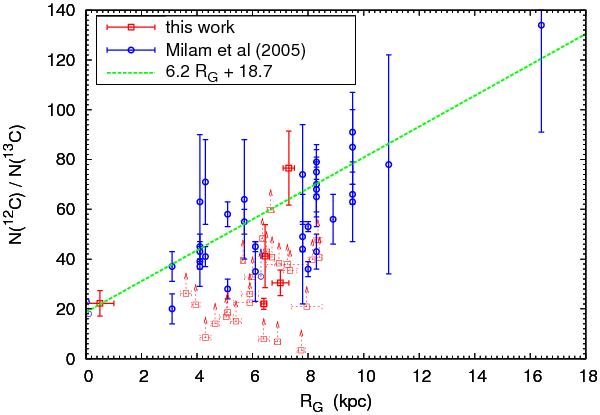
N(12C)/N(13C) column density ratio as a function of the galactocentric distance RG. The red squares are from this work, and therefore evaluated with measurements of the N(12CH+)/N(13CH+) column density ratio. The blue circles are from previous measurements of the N(12CN)/N(13CN), N(12CO)/N(13CO), and  column density ratios (Milam et al. 2005 and references therein) while the green curve corresponds to a linear least-squares fit applied to these data.
Current usage metrics show cumulative count of Article Views (full-text article views including HTML views, PDF and ePub downloads, according to the available data) and Abstracts Views on Vision4Press platform.
Data correspond to usage on the plateform after 2015. The current usage metrics is available 48-96 hours after online publication and is updated daily on week days.
Initial download of the metrics may take a while.