Fig. 3
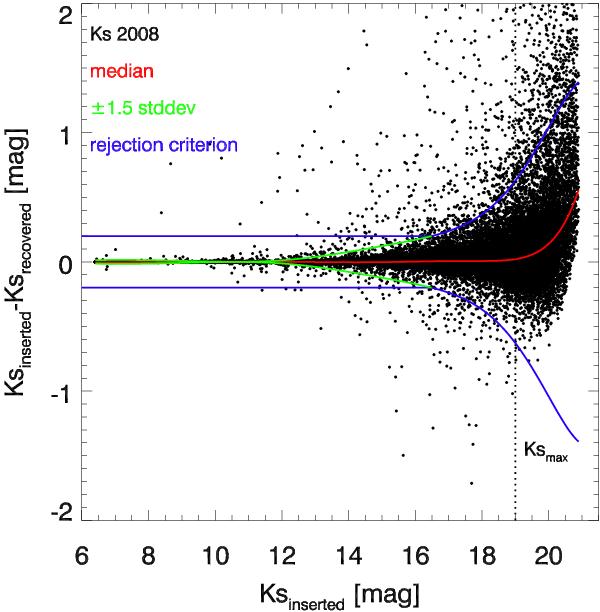
Difference of the inserted and recovered magnitudes of artificial stars inserted into the combined image of the Ks-band data in 2008 plotted vs. the magnitude. A high-order polynomial fit to the median and the standard deviation (multiplied by a factor of 1.5) of the magnitude difference within magnitude bins of 1 mag are shown as well. The vertical dotted line indicates the maximum Ks-band magnitude at Ks = 19 mag of stars to be used for the proper motion analysis.
Current usage metrics show cumulative count of Article Views (full-text article views including HTML views, PDF and ePub downloads, according to the available data) and Abstracts Views on Vision4Press platform.
Data correspond to usage on the plateform after 2015. The current usage metrics is available 48-96 hours after online publication and is updated daily on week days.
Initial download of the metrics may take a while.