Fig. 12
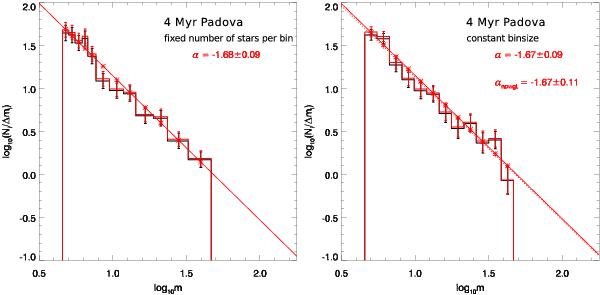
Comparison of the mass function and derived slopes for different methods of binning the data and performing the linear fit. Only the fit and derived slope for the completeness corrected mass function are shown. Left panel: mass function of the Quintuplet cluster with initial masses derived from the 4 Myr Padova isochrone. Only stars with m > 4.6 M⊙, i.e. stars above the ambiguity region in the CMD due to the PMS, are used. Wolf-Rayet stars are not included in the mass function, as the large uncertainty of their mass might bias the derived slopes. The bin sizes are adjusted such that each of the 12 bins holds approximately the same number of stars. Right panel: mass function of the same data but distributing the stars into 12 bins of a uniform logarithmic width of 0.084 dex adopting the same lower and upper mass limits as in the left panel. The solid line shows the weighted linear fit, the dotted line the unweighted fit.
Current usage metrics show cumulative count of Article Views (full-text article views including HTML views, PDF and ePub downloads, according to the available data) and Abstracts Views on Vision4Press platform.
Data correspond to usage on the plateform after 2015. The current usage metrics is available 48-96 hours after online publication and is updated daily on week days.
Initial download of the metrics may take a while.