Fig. 9
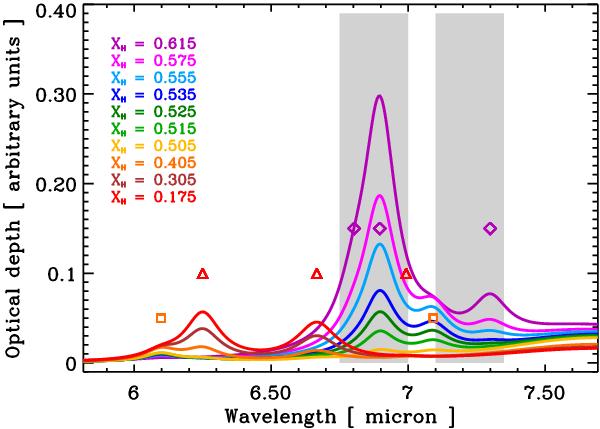
The predicted eRCN spectrum in the 6.0−7.5 μm C-H bending and C-C mode region as a function of XH calculated using the structural de-composition described in Sect. 2.2.3 and the data in Table 2. The symbols are the same as for the previous figure. The grey shaded areas indicate the approximate full width of the observed a-C:H bands in this region (e.g., Pendleton & Allamandola 2002; Dartois et al. 2005).
Current usage metrics show cumulative count of Article Views (full-text article views including HTML views, PDF and ePub downloads, according to the available data) and Abstracts Views on Vision4Press platform.
Data correspond to usage on the plateform after 2015. The current usage metrics is available 48-96 hours after online publication and is updated daily on week days.
Initial download of the metrics may take a while.