Fig. 8
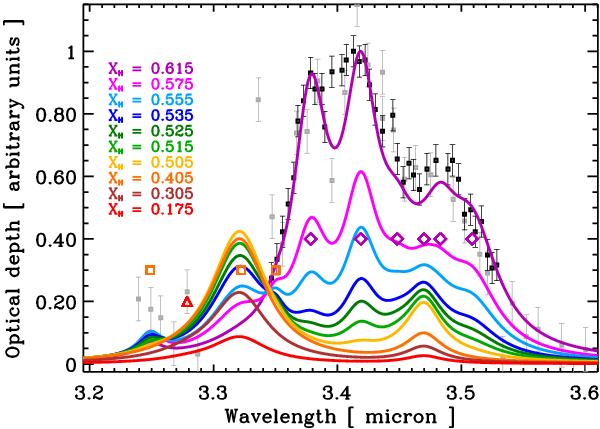
The predicted eRCN spectrum in the 3.2−3.6 μm C-H stretching region as a function of XH calculated using the structural de-composition described in Sect. 2.2.3 and the data in Table 2. The diamonds, squares and triangles indicate the aliphatic, olefinic and aromatic band positions, respectively (see Table 2). The data with error bars are for the diffuse ISM absorption along the Galactic Centre IRS6E line of sight (black) and Cyg OB2 No. 12 (grey) (taken from Pendleton & Allamandola 2002).
Current usage metrics show cumulative count of Article Views (full-text article views including HTML views, PDF and ePub downloads, according to the available data) and Abstracts Views on Vision4Press platform.
Data correspond to usage on the plateform after 2015. The current usage metrics is available 48-96 hours after online publication and is updated daily on week days.
Initial download of the metrics may take a while.