Fig. 13
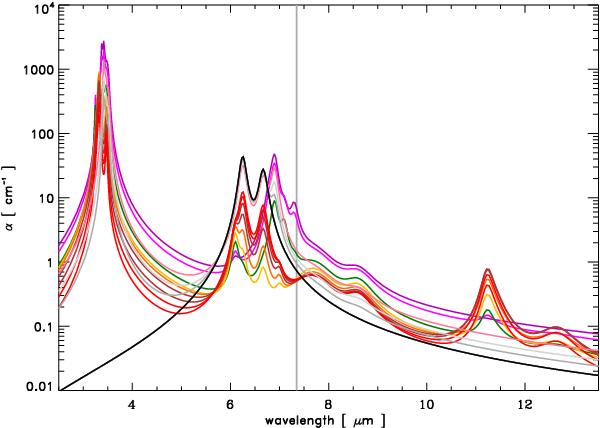
The predicted eRCN and DG spectra, presented as the absorption coefficient, α, in the 2.5 − 13.5 μm region as a function of Eg calculated using the structural de-composition described in Sects. 2.2.3, 2.2.4 and 2.3 and for the data in Table 2. The adopted colour-coding for this plot is from large band gap (2.67 eV, purple) to low band gap (–0.1 eV, black) with intermediate values in steps of 0.25 eV from 2.5 (violet) to 0 eV (grey) with the addition of the Eg = 0.1 and − 0.1 eV cases (light grey and black, respectively), as per Paper II. The bands with central positions long-ward of the vertical grey line (λ(ν0) > 7.3 μm) are not yet well-determined by laboratory measurements.
Current usage metrics show cumulative count of Article Views (full-text article views including HTML views, PDF and ePub downloads, according to the available data) and Abstracts Views on Vision4Press platform.
Data correspond to usage on the plateform after 2015. The current usage metrics is available 48-96 hours after online publication and is updated daily on week days.
Initial download of the metrics may take a while.