Fig. 11
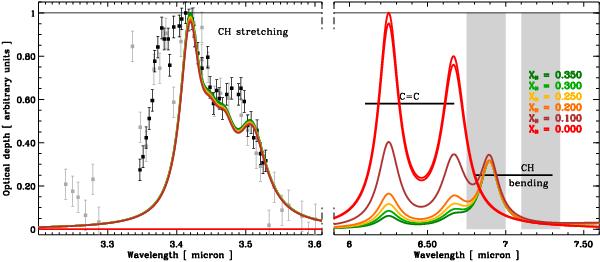
The predicted full DG spectrum in the 3−8 μm C-H stretching and bending and C-C mode region as a function of XH calculated using the structural de-composition described in Sect. 2.2.3 and the data in Table 2. Here the spectra are normalised to the strongest band for each value of XH. On the left the strongest bands are for high XH > 0 (green to brown), while the opposite is true for the longer wavelength bands on the right (shortward of 6.8 μm). The data with error bars and the shaded areas indicate the diffuse ISM bands as per Figs. 8 and 9.
Current usage metrics show cumulative count of Article Views (full-text article views including HTML views, PDF and ePub downloads, according to the available data) and Abstracts Views on Vision4Press platform.
Data correspond to usage on the plateform after 2015. The current usage metrics is available 48-96 hours after online publication and is updated daily on week days.
Initial download of the metrics may take a while.