| Issue |
A&A
Volume 540, April 2012
|
|
|---|---|---|
| Article Number | A40 | |
| Number of page(s) | 8 | |
| Section | Atomic, molecular, and nuclear data | |
| DOI | https://doi.org/10.1051/0004-6361/201117128 | |
| Published online | 22 March 2012 | |
Kinetics of OCN− formation from the HNCO + NH3 solid-state thermal reaction
Aix-Marseille Univ, PIIM UMR 7345, CNRS, 13397 Marseille, France
e-mail: This email address is being protected from spambots. You need JavaScript enabled to view it.
Received: 22 April 2011
Accepted: 27 January 2012
Abstract
Context. Solid-state features in infrared astronomical spectra can provide useful information on interstellar ices within different astrophysical environments. Solid OCN− has an absorption feature at 4.62 μm, which is observed in star formation regions only with a large source-to-source abundance variation.
Aims. We aim to investigate the thermal formation mechanism of solid OCN− from HNCO on the basis of kinetic arguments.
Methods. We experimentally studied the kinetics of the low-temperature OCN− formation from the purely thermal reaction between HNCO and NH3 in interstellar ice analogs using Fourier transform infrared spectroscopy. We used a rate equation approach, a kinetic Monte Carlo approach and a gamma probability distribution approach to derive kinetic parameters from experimental data.
Results. The kinetics can de divided into two-processes, a fast process corresponding to the chemical reaction, and a slow process that we interpret as the spatial orientation of the two reactants within the ice. The three approaches give the same results. The HNCO + NH3 → OCN− + NH4+ reaction rate follows an Arrhenius law with an activation energy of 0.4 ± 0.1 kJ mol-1 (48 ± 12 K) and a pre-exponential factor of 0.0035 ± 0.0015 s-1.
Conclusions. The present experiment has the important implication that the HNCO + NH3 reaction can account for the observed abundances of solid OCN− and the HNCO non detection in young stellar objects.
Key words: astrochemistry / ISM: molecules / molecular processes
© ESO, 2012
1. Introduction
The strong absorption feature at 4.62 microns (2165 cm-1), called the XCN band, is commonly attributed to the solid-phase cyanate ion OCN− (Soifer et al. 1979; Grim & Greenberg 1987; Lowenthal et al. 2000; Novozamsky et al. 2001). Although absent in starless dark molecular clouds (Knez et al. 2005), this feature appears in the spectra of several protostellar objects with large source-to-source abundance variations (van Broekhuizen et al. 2005). The OCN− band is therefore often seen as a manifestation of energetic processes, thermal or non-thermal, in a protostellar environment.
Solid-state OCN− can originate from different processes: proton bombardment (Moore et al. 1983), electron bombardment (Bennett et al. 2010), vacuum ultraviolet photolysis of NH3:CO:H2O ices where the photochemical formation of isocyanic acid HNCO is followed by a proton transfer to ammonia NH3 (d’Hendecourt et al. 1986b; Grim et al. 1989), or directly from an acid-base reaction of HNCO with solid NH3 or H2O (Demyk et al. 1998; Raunier 2003b,a; van Broekhuizen et al. 2004). The quantitative comparison of these different processes made in vanBroekhuizen et al. (2004) tends to show that the UV photoprocessing of NH3:CO:H2O ices may not account for the observed OCN− abundances, and that OCN− is most likely formed thermally from HNCO. The thermal formation from the reaction between HNCO and either NH3 or H2O could explain the large variations in abundances observed in VLT studies of low-mass young stellar objects (YSOs) (van Broekhuizen et al. 2005), which are difficult to explain by photochemistry. However, the validity of these mechanisms to reproduce or not reproduce, the observed abundances of OCN− depends on their respective efficiency and kinetics and on the initial abundance of the HNCO reactant. The kinetic study of the HNCO + H2O solid-state reaction has been investigated (Theule et al. 2011) and an activation barrier of 26 kJ mol-1 (3127 K) has been found for this reaction. A barrier like this is too high for this reaction to occur on YSO timescales or to counterbalance faster reactions such as hydrogenation of HNCO in molecular clouds. HNCO + NH3 and HNCO + H2O are two competitive reactions, but the timescale of the latter one is much longer than the timescale of the former, so we only need to consider the HNCO + NH3 reaction on our experimental timescales.
In this paper we measure the kinetics of the HNCO + NH3 → OCN−+ NH4+ isolated solid-state reaction on the basis of laboratory experiments using Fourier transform infrared (FTIR) spectroscopy between 8 K and 60 K. Using a rate-equation approach, a kinetic Monte Carlo (KMC) approach and a gamma probability distribution approach, we show that the kinetics can be decomposed into two successive steps. One fast step, corresponding to the reaction itself, follows a second-order kinetic law, and its reaction rate follows an Arrhenius law with an activation energy of 0.4 ± 0.1 kJ mol-1 (48 ± 12 K) and a pre-exponential factor of 0.0035 ± 0.0015 s-1. One slow step, corresponding to the reorientation of the molecules position within the molecular solid, follows a first-order kinetic law. This experimental work provides the reference input data to a gas-grain chemistry model that we will use to discuss the observed solid-state OCN− abundances in different astrophysical objects.
2. Experimental
The HNCO monomer was synthetized from the thermal decomposition of the cyanuric acid polymer (Aldrich Chemical Co., 98%) at 650 °C under a primary vacuum. Ammonia is commercially available as a 99.999% pure gas from Air Liquide. HNCO and NH3 were inserted into two separated vacuum lines using standard manometric techniques, outgassed and then co-deposited. The two gases were sprayed onto a gold plated copper surface maintained at 10 K using a closed-cycle helium cryostat (ARS Cryo, model DE-204 SB) within a high vacuum chamber at few 10-9 mbar pressure. Infrared spectra were recorded at different temperatures using Fourier transform reflection absorption infrared spectroscopy (FT-RAIRS) using an Vertex 70 spectrometer with a MCT detector. A typical spectrum has a 1 cm-1 resolution and is averaged over one hundred interferograms.
The concentration ratio of the different mixtures is derived after deposition at 10 K from the IR spectra by integrating the HNCO and NH3 bands to estimate their column densities according to their band strengths. For NH3 we used the value of 1.3 × 10⁻¹⁷ cm molecule-1 for the band strength of the wagging mode at 1070 cm-1 (Kerkhof et al. 1999) in its pure solid form. For HNCO, we adopted the value of 7.8 × 10⁻¹⁷ cm molecule-1 for the band strength of the νasNCO mode at 2259 cm-1, which is the value given for a H2O-poor ice (van Broekhuizen et al. 2004). For OCN− we used the value of 1.3 × 10⁻¹⁶ cm molecule-1 for the band strength of the νasNCO mode (van Broekhuizen et al. 2004). However, the calculated concentration ratio depends on the band strengths provided by the literature. These values depend on the nature, composition, and temperature of the ice in which they are found, and this dependence is a major source of uncertainties when evaluating the column densities of frozen molecules. A 20% uncertainty on the band strengths and accordingly on concentration ratios is probably conservative. A typical ice mixture has a few hundreds of monolayers thickness according to integrated molecules IR bands and Table 1 band strengths, assuming a 1015 molecule cm-2 surface density. We used these bands to monitor the evolution of the HNCO and OCN− abundances as they are consumed or produced during the reaction to estimate the different kinetic parameters. The uncertainty on the band strengths has no influence on the time evolution of the molecule abundances, and accordingly on the derived kinetic parameters. In these experiments, only bulk effects are concerned since our set-up is fairly insensitive to surface molecules.
In a typical kinetic experiment, the temperature is set to a fixed value using a Lakeshore Model 336 temperature controller and measured using a DTGS 670 Silicon diode with a 0.1 K uncertainty. The temperature is set at a fixed value between 8 K and 300 K using a heating resistance and the temperature controller. Infrared spectra are recorded at this fixed temperature at fixed time intervals.
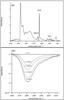 |
Fig. 1 a) Infrared spectrum of an HNCO:NH3 ice mixture in a 1:20 ratio. OCN− has a band at 2151 cm-1. HNCO has a band at 2259 cm-1 corresponding to HNCO in a NH3 environment. b) Difference spectrum with respect to t = 0 s of the HNCO 2259 cm-1 band at T = 15 K at t = 5300 s, 10 000 s, 21 000 s, and 31 000 s. |
3. Results
3.1. Kinetic measurements of the HNCO + NH3 → OCN−NH4+ reaction at a fixed temperature
An HNCO:NH3 ice mixture where NH3 is in excess with respect to HNCO is deposited at T = 10 K, as shown in Fig. 1a. An excess of NH3 with respect to HNCO is chosen so that one HNCO molecule is surrounded by NH3 molecules only. An excess of NH3 is consistent with observations of interstellar ices against high-mass (Dartois 2005) and low-mass (Bottinelli et al. 2010) stars, which indicate that NH3 is present within few percents with respect to H2O, and that HNCO is not observed (estimated upper limit of 0.1%). We typically used an HNCO:NH3 ice mixture in a 1:20 ratio to have an excess of NH3 with respect to HNCO. Different mixing ratios will give the same results because the probability of the reaction is set by the less abundant species, HNCO in this case. How many NH3 molecules are spectators and do not participate to the reaction has no effect on the kinetics.
At 10 K the ammonia spectrum is characterized by its strong band at 1110 cm-1 assigned to the inversion mode. Isocyanic acid HNCO is characterized by strong bands located at 3373, 3233, 2259 and 858 cm-1. The most intense band at 2259 cm-1 is assigned to the NCO asymmetric stretch vibration. The isocyanate ion OCN− is characterized by its intense band at 2151 cm-1 and the ammonium ion NH4+ is characterized by its band at 1495 cm-1. Since the HNCO + NH3 reaction is possible during the deposition step when the gases at 300 K are co-deposited onto the cold metal surface, and thermalized from 300 K to 10 K, a significant amount of OCN− is initially formed as seen from its band at 2151 cm-1 immediately after deposition at 10 K. The amount of initially formed OCN− slightly varies from one deposition to another. However, an initial amount of solid HNCO remains after deposition, and will react with solid NH3 at the metal surface temperature. An extensive vibrational assignment of the OCN− and NH4+ products is given in Raunier et al. (2003a). All observed bands are listed in Table 1 along with their corresponding assignments and band strengths. There are no unassigned bands, which means that there are no other reactions and that NH4+ and OCN− cannot react any further.
Positions and integrated band strengths of an HNCO:NH3 ice mixture at 10 K.
After deposition the HNCO:NH3 ice mixture is warmed as fast as possible, in few tens of seconds approximately, to a fixed temperature, between 10 K and 60 K, without overshooting the fixed temperature value. This defines the initial time (t = 0 s) of the kinetic experiment. When the temperature is kept to this fixed value, the OCN− band at 2151 cm-1 and the NH4+ band at 1495 cm-1 are progressively growing, while the bands corresponding to HNCO and NH3 are decreasing along with time. This indicates that a thermally induced reaction between HNCO and NH3 is occurring to give the NH4+OCN− product, as previously studied (Raunier 2003a). We will not use the OCN− asymmetric stretch at 2151 cm-1 to monitor the NH4+OCN− product formation since OCN− is reorganizing between 10 K and 40 K within a time scale similar to the reaction time scale, as shown by a characteristic crystallization band profile. We will instead use the HNCO band at 2259 cm-1 to monitor the kinetics of the HNCO transformation into OCN−. Figure 1b shows the evolution along with time of a HNCO:NH3 ice mixture in a 1:20 ratio at a fixed 15 K temperature.
During this reaction a proton is transferred from the HNCO nitrogen atom to the NH3 nitrogen atom to form the OCN−NH4+ species as expressed in  (1)There is no desorption of the different species at temperatures below 60 K, because the HNCO, NH3 and OCN− desorption energies are high (Burke & Brown 2010; Theule et al. 2011) and desorb around 130 K within our experimental conditions. Moreover, no HOCN that may come from the reaction NH4+ + OCN− → HOCN + NH3 is observed from its band at 2295 cm-1 (Raunier 2003a; Theule et al. 2011). NH3 is a much stronger base than H2O, consequently a proton transfer from NH4+ is more difficult to achieve.
To derive a kinetic law for the formation of NH4+OCN− from the HNCO + NH3 reaction, we carried out experiments at different fixed temperatures. The temperature must be sufficiently high for the formation to be measured in a realistic time scale of a few hours, which corresponds to a temperature above 8 K. However, for temperatures above 60 K, the reaction is too fast to be able to measure its kinetics, so the measurement range is limited between approximately 8 K and 60 K. Figure 2 shows the decrease of the HNCO normalized column density along with time, as derived from its integrated band at 2259 cm-1, at different fixed temperatures. Not 100% of HNCO is consumed during a c.a. 12 h time scale. Although the reaction is total and not partial (Theule et al. 2011), only 30% of HNCO is consumed for all experiments on this limited time scale.
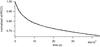 |
Fig. 2 Time evolution of the normalized HNCO molar fraction recorded by FTIR spectroscopy (full line) at T = 20 K for a HNCO:NH3 mixture where NH3 is largely in excess (1:20 concentration ratio). Fitting the experimental data against the analytical expressions for the HNCO time evolution using a rate equation approach (dashed line), a Monte Carlo approach (dotted-dashed line) and a gamma probability distribution (dotted line) gives the value for the reaction rate at a fixed temperature. The three approaches perfectly fit the experimental HNCO decay curve. |
3.2. Kinetic studies of the HNCO + NH3 reaction using a rate equation approach
We first used a deterministic approach based on rate equations to express the time evolution of HNCO. The kinetics of solid-state reactions cannot generally be assumed to follow simple rate laws, as is the case for gas-phase or liquid-phase reactions. Different solid-state models have been developed to extract Arrhenius parameters from thermal analysis experiments (Viazovkin & Wight 1997). We write the kinetic equations under the general power law form ![Mathematical equation: \begin{equation} \label{kineticequationsgenform} \left\{\begin{array}{rcl} \frac{{\rm d}x({\rm HNCO})}{{\rm d}t}&=& -k(T)\times x({\rm NH}_3)^\alpha\times x({\rm HNCO})^\beta\\[1.5mm] \frac{{\rm d}x({\rm OCN}^-)}{{\rm d}t}&=& k(T)\times x({\rm NH}_3)^\alpha\times x({\rm HNCO})^\beta ,\\ \end{array}\right. \end{equation}](/articles/aa/full_html/2012/04/aa17128-11/aa17128-11-eq41.png) (2)where x(NH3) and x(HNCO) are the unitless molar fraction of NH3 and HNCO, α and β the partial orders of the reaction for NH3 and HNCO, respectively, and k(T) is the rate of the reaction. To obtain a comprehensive expression for the rate of the reaction, we need to derive k(T), α and β from the experimental data. α and β are not necessarily equal to unity.
(2)where x(NH3) and x(HNCO) are the unitless molar fraction of NH3 and HNCO, α and β the partial orders of the reaction for NH3 and HNCO, respectively, and k(T) is the rate of the reaction. To obtain a comprehensive expression for the rate of the reaction, we need to derive k(T), α and β from the experimental data. α and β are not necessarily equal to unity.
Figure 2 shows that the HNCO decay as a function of time does not reach zero. Because HNCO is highly diluted into NH3, x(NH3)α ≃ 1, and this factor is almost constant throughout the reaction.
The HNCO decay cannot be satisfactorily fitted by a first- (β = 1) or second- order decay (β = 2). To explain the peculiar decay curve shape and that the reaction yield is not 100%, we break down the HNCO decay into two processes: a fast process and a slow process.
This two-consecutive-step model allows us to isolate two phenomena occurring on two different timescales. The first step of the reaction is a slow process, which is interpretated as a change on geometrical configuration of HNCO within its NH3 environment, since HNCO can be orientated in different configurations with respect to NH3 (Benderskii et al. 1994). This slow process consists of HNCO rotating around its center of mass within its NH3 environment, to achieve a configuration state, noted HNCOa, which corresponds to the configuration enabling the chemical reaction. This steering motion may be purely entropic, similar to a phase change, because the amorphous solid may be out of equilibrium and going toward a lower free enthalpy G corresponding to a more organized state. Reorientation (or isomerization) effects are well-known in rare gas cryogenic matrices (Benderskii et al. 1994). HNCOa is a chemically active configuration that corresponds to the orientation of HNCO with the hydrogen atom pointing toward the ammonia-free electronic doublet, so that the NH actually reacting with HNCOa among the other NH3 molecule will be this proton acceptor NH. The activated complex is therefore the pair HNCOa-NH. The other non-chemically active configurations for HNCO are condensed in the notation HNCOna. This change of orientation from a non-active HNCOna configuration to the active HNCOa configuration is modeled by a single barrier and a single rate ko, although there must be a distribution of non-active configurations and a distribution of reorientation barriers. Since this change can be described by an unimolecular elementary process, its order is one. The fast process corresponds to a low activation barrier reaction and has a rate constant kr.
This two-consecutive-step model is expressed in Eq. (3):  (3)Because the HNCOa proton donor is necessarily reacting with the NH proton acceptor in a one-on-one way, the decay rate of x(HNCOa) is proportional to the molar fraction of the NH-HNCOa pair, and thus to x(HNCOa). We then can write the kinetic equations for the two consecutive phenomena as two consecutive first-order reactions:
 ![Mathematical equation: \begin{equation} \label{kineticequations} \left\{ \begin{array}{l} \frac{{\rm d}x({\rm HNCO}^{\rm na})}{{\rm d}t} = -k_{\rm o}(T)\times x({\rm HNCO}^{\rm na}) \\[1mm] \frac{{\rm d}x({\rm HNCO}^{\rm a})}{{\rm d}t} = k_{\rm o}(T)\times x({\rm HNCO}^{\rm na})-k_{\rm r}(T)\times x({\rm HNCO}^{\rm a}) . \end{array}\right. \end{equation}](/articles/aa/full_html/2012/04/aa17128-11/aa17128-11-eq55.png) (4)There is no spectroscopic difference between HNCOna and HNCOa, since experimentally we record HNCO(t) = HNCO
(4)There is no spectroscopic difference between HNCOna and HNCOa, since experimentally we record HNCO(t) = HNCO + HNCO
 . Solving Eq. (4) we can derive the analytical expression for the variation of the HNCO abundance as a function of time:
  (5)where x(HNCOna)(t=0) and x(HNCOa)(t=0) correspond to the initial population of HNCO in a chemically inactive or active configuration, and accordingly we have x(HNCOna)(t = 0) + x(HNCOa)(t = 0) = x(HNCO)(t = 0) = 1 because we normalized the decay curve to 1.
The activation energy of diffusion of HNCO within a NH3 ice should be on the order of magnitude of a few 10 kJ mol-1, the energy required to break few intermolecular hydrogen bonds (Park et al. 2010). As a comparison the activation energy of the self-diffusion in bulk ice is  kJ mol-1 (George et al. 1997; Livingston et al. 1997). Therefore the diffusion of the molecules can be neglected between 8 and 60 K, on the time scale of our experiments, around 12 h typically. Moreover, because HNCO is a minor constituent in an NH3 ice, the two reactants are compulsorily in contact, and no diffusion is needed to make pairs of reactants.
Fitting the experimental data against the analytical expression of Eq. (5) at a fixed temperature, as shown in Fig. 2, allows one to extract ko, kr and HNCO for this temperature. We derived these three parameters from several kinetic experiments performed at different fixed temperatures, as summarized in Table 2. Several measurements were made at a same temperature, 20 K, to estimate the dispersion of the results, which might have been caused by the inhomogeneity of our ice mixture deposition. The dispersion measured at 20 K was then assumed for all other temperatures.
Experimental reaction rates (see text) for the HNCO + NH3 → NH4+ + OCN− chemical reaction as a function of temperature.
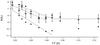 |
Fig. 3 ln( |

We note that within the measurement dispersion, at the initial time the proportion of HNCO in a chemically active or non-active state, the x(HNCO ) and x(HNCO) molar fractions do not vary with the temperature of the isothermal kinetic experiment as they should at the equilibrium. Because the x(HNCO)/x(HNCO) ratio at the equilibrium is a function of the ratio between the difference of HNCO and HNCO free Gibbs energy and the equilibrium temperature, the relevant temperature ought to be constant for all experiments to get a constant x(HNCO)/x(HNCO) ratio. This temperature may be the room temperature at which the deposition of the two gases is performed, the room temperature proportion between HNCO and HNCO is frozen when the molecular solid is condensed onto the cold surface. At a 300 K room temperature, we found a difference in Gibbs energy of 4.3 kJ mol-1, which is on the order of magnitude of a molecular reorientation (Mielke et al. 2006, 2008). This means that our ice analogs, made from a room temperature gas quenching into an amorphous solid, are out of equilibrium. Therefore they must tend toward the equilibrium corresponding to the temperature at which each experiment is performed within a certain amount of time. This time scale is not astrophysically relevant since the making process of an interstellar ice in a dense molecular cloud is different. The orientation phenomenon is of the same physical nature as the reorganization of the out of equilibrium ice mixture, i.e. the breaking and reorganization of a hydrogen bond network, the hindered rotation of molecules within a solid. Consequently, the ko rate constant should be temperature-dependent, although not necessarily equal to the hydrogen bond network reorganization rate. Although not astrophysically relevant, the ko rate constant must be taken into account to correctly derive the kr reaction rate.
We now determine the temperature dependence of kr(T). Figure 3 shows that kr(T) has two temperature domains. In the first domain, between 60 K and 15 K, the reaction rate can be fitted against an Arrhenius law 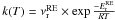 . We found an activation energy
  kJ mol-1 (48 ± 12 K) and a pre-exponential factor
  s-1 for the reaction between 60 K and 15 K. In the second domain between 15 K and 8 K, the reaction rate levels off, and the temperature dependence shows a plateau. A plateau like this in the reaction rate temperature dependence has been seen in many low-temperature systems (Benderskii et al. 1994) and can be interpreted as caused by a quantum tunneling reaction. This quantum tunneling regime coexists with the thermal regime, but becomes predominant at low temperature when the thermally induced reaction becomes minor.
The orientation phenomenon does not exhibit a dependence in temperature and has an average value of ko= 3 ± 1 × 10⁻⁶ s-1, and consequently we cannot determine an activation energy  and a pre-exponential factor
  for ko. This indicates that the orientation phenomenon is non-thermal. This orientation phenomenon should be temperature-dependent since it is of the same physical nature as the reorganization of the out of equilibrium ice mixture. However, as shown in Fig. 4, the orientation phenomenon we observed in our experiments is non-thermal and induced by the mid-infrared photons from the mid-IR source of our FTIR spectrometer. This mid-IR source has a temperature of few thousand Kelvin and emits as a black-body in the mid-infrared. Figure 4 shows the difference between the HNCO band decay at 8 K if the ice mixture is irradiated in between two measurements by the mid-IR source beam and if the mid-IR source beam is blocked in between two measurements.
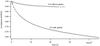 |
Fig. 4 Decay curves of x(HNCO)(t) at 8 K, with and without the ice sample irradiated with the FTIR spectrometer beam in between two measures. The FTIR spectrometer clearly has an effect on the slow orientation process, while the fast reaction process is not affected. |
Fitting these two decay curves with Eq. (5) gives the same  , which means that the plateau in the temperature dependence is not induced by the IR photons, but is a real quantum tunneling. However,
  is extremely low at 8 K when the mid-IR source is blocked. When the mid-IR source is not blocked, the observed is non-thermal and induced by the IR photons of the spectrometer, and consequently does not have a temperature dependence. The FTIR photons are changing the distribution of populations from a Maxwell-Boltzmann thermal distribution to a distribution where IR photons can populate higher energy states of the complex, because the reorientation potential energy surface is probably very shallow. These states are closer to the reorientation barrier and consequently the kinetics is enhanced. Therefore, the spectrometer IR photons both cloud the temperature dependence of the orientation process and accelerate it. This IR-induced orientation is an experimental artifact and is not astrophyically relevant, but must be taken into account to correctly derive kr.
This simple two-step model allows us to explain the HNCO time decay curve, especially the fact that the reaction does not reach completion, while irreversible (total). The activation barrier  is small, 0.4 ± 0.1 kJ mol-1 (48 ± 12 K), accordingly the thermal reaction HNCO + NH3 → NH4+ + OCN− needs to be taken into account in the interstellar ice reactions network.
3.3. Kinetic studies of the HNCO + NH3 reaction using a kinetic Monte Carlo approach
In addition to using a deterministic rate equation approach as in Sect. 3.2, we used a kinetic Monte Carlo approach to fit the experimental kinetic data. Chemistry on grain mantle is by nature stochastic, because interstellar grains are cell-like objects and the non-abundant molecules (complex organic molecules mainly) population is small (sometimes ≤ 1 per grain) (Charnley 1998). Much work has been done to apply Monte Carlo methods to gas-grain chemitry (Charnley 1998; Lipshtat & Biham 2003; Chang et al. 2007) or to modify the rate equation formalism to take into account the stochastic effects (Garrod et al. 2009). While our experiments are not in the low-abundance limiting case (HNCO is diluted into NH3 in a 1:20 concentration ratio within a single macroscopic sample and thus we are definitely within the thermodynamic limit), we used the Monte Carlo formalism applied to coupled chemical reactions (Gillespie 1976) to compare it with the rate equation formalism in the simplest case possible: only one two-body solid-state reaction with no diffusion effect.
To do this, we used the PIZZAZZ code (Jansen 1995). PIZZAZZ is a general purpose program, developed by Dr. Jansen, and designed to simulate reactions on 3D regular grids. It is an implementation of the “first reaction method” (Gillespie 1976). Our simulations were performed using a 3D grid of 100 × 100 × 100 sites to consider bulk reactions in the ice volume. The initial configuration is set randomly according to an initial reactants ratio HNCO/NH3 that was measured on the experimental spectra, and we completely filled the grid according to this ratio. We saw in Sect. 3.2 that the evolution of HNCO abundance can be explained by two processes, a slow process that activates the HNCO molecules and a fast process corresponding to the reaction of activated HNCO with NH3. We also saw that there was a non-trivial ratio of HNCOa/HNCOna at the beginning of the reaction. Because this quantity cannot be measured, it was kept unconstrained. Therefore, we have three parameters to explore: the reaction rate kr, the activation rate ko, and HNCO since HNCO . These three parameters were varied to fit the experimental data. The chi square surface resulting from the fit optimization was explored over the parameters space as shown in Fig. 5. We can see that there is a global minimum and that the uncertainty caused by the stochastic fitting procedure is smaller than the experimental dispersion, which is assumed to be the same as the dispersion at 20 K determined using the rate equation approach, because it is mainly caused by an experimental reproducibility due to the heterogeneous nature of the ice samples. We can also see that there is a defined global minimum between kr and HNCO, which fixes HNCO, while there is a correlation between ko and HNCO, which leads to a less reliable value of ko. The results of the fits using the Monte Carlo approach are summarized in Table 2.
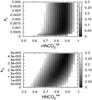 |
Fig. 5 Chi square surface in grayscale, resulting from a fit of experimental HNCO decay at 20 K as a function of the activation rate kr and HNCO |
We can now determine the temperature dependence of  and
and  by fitting the reaction rates at different temperatures against an Arrhenius law, as shown in Fig. 3. As observed previously in the rate equation approach, there is no noticable variation of
  with temperature and we find a rate
  s-1 for the orientation phenomenon. We find an activation energy
  = 0.4 ± 0.2 kJ mol-1 (48 ± 24 K) and a pre-exponential factor
  s-1 for the reaction rate.
Within the uncertainty, the same activation energy and pre-exponential factor are found for the reaction using the rate equation approach and the Monte Carlo approach. This equality of rates on one thermal reaction within a macroscopic ice sample is significant because it is a first step to validate the equivalence between using a rate equations approach or a Monte Carlo approach in a gas-grain chemistry code.
3.4. Kinetic studies of the HNCO + NH3 reaction using a gamma probability distribution of orientations
To go beyond the simple model expressed in Eq. (3) and to account for the fact that there is no single HNCOna state but rather a distribution of HNCOna states, we considered a distribution of HNCO configurations, each one of them with its own kr reaction constant. The difference between kr reaction constants stems from the difference in the orientation energy of each site, the reaction rate of the activated complex being the same, following the two-step process approach described in Eq. (3). However, we considered that a distribution of ko that is translated into a distribution of kr. Accordingly, we can write the HNCO decay rate as a sum of exponential decays: 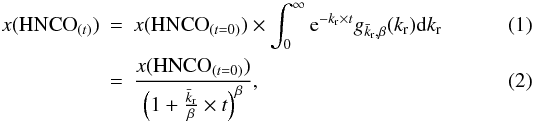 where the kr rates are distributed according to a gamma probability distribution function with a
  mean value
 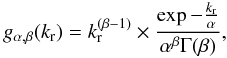 (8)where α and β are the scale and the shape factors respectively, and we have
  (Johnson et al. 1995).
The gamma probability distribution function is a generalization of the chi-square probability distribution function, i.e. β = n/2 can be non-integer and lower than 1, n being the degree of freedom of the chi-square distribution (Johnson et al. 1995). The integration of this distribution gives a power law, as seen in Eq. (6).
The chi-square distribution has been previously used to describe dynamical processes in many different systems, such as intramolecular vibrational redistribution (Uzer & Miller 2004) or relaxation processes in amorphous solids (Cannizzo et al. 2008). These processes are described by the random-matrix theory, which applies well to chaotic or disordered systems. We tentatively give a physical explanation for the good agreement of our experimental curve with a gamma probability distribution function, based on two assumptions. The first assumption is that each individual non-active HNCO site corresponds to one particular geometrical orientation of the molecules, with one possible realization of cna/a, the coupling strength between the HNCO non-active state and the HNCOa pre-reaction complex. At high energy, close to the top of the reaction barrier, the cna/a coupling strengths are independently distributed, according to the central limit theorem, with a Gaussian probability P(cna/a) around
  , the average coupling strength, and we have
 . The average coupling strength can be physically seen as the average overlap between HNCO and HNCOa wavefunctions. The second assumption is that the inhomogeneous ensemble of the sites corresponds to a large and statistically independent sample of all possible random realizations of kr. Thus, the orientation rate kr is the sum of the squares of the independent, standard normal random variables, and as such is distributed according to a gamma distribution with 2β degrees of freedom and an average value . 2β is not directly the number of non-active sites, but rather the degree of disorder of the system. In the limit β ≫ 1, the distribution tends to a narrowly peaked Gaussian, which would correspond to a highly disordered system, where all configurations are explored during the measurement process. In our case, the number of orientational configurations HNCO is large, but finite; the system is disordered, but there is no fast conversion between the different configurations like in liquids or solids, which corresponds to a low-β case. This case corresponds to high fluctuations around the mean value, which is shown by the high fluctuations in the results measured at 20 K.
Fitting the experimental HNCO decay curve against Eq. (6), as seen in Fig. 2, gives β and at each temperature, as shown in Table 2. We find β around 0.10, varying between 0.05 and 0.18, since the population of the different HNCO sites can vary from one ice mixture deposition to another. However, Fig. 4 shows how the populations can be altered by the spectrometer IR photons. Fitting Fig. 4 with Eq. (6) gives the same but a β parameter different by a factor of seven. We find a thermal regime between 60 K and 15 K and a quantum regime between 15 K and 8 K for the value, like in the rate equation and Monte Carlo approaches. Fitting the reaction rate temperature dependance against an Arrhenius law between 60 K and 15 K, as shown in Fig. 3, gives an activation energy Er = 0.61 ± 0.02 kJ mol-1 (73 ± 3 K) and a pre-exponential factor  = 0.003 ± 0.002 s-1. Between 15 K and 8 K,
  s-1. These values are similar, though slightly lower, to the values found using the rate equation and Monte Carlo approaches. This simple statistic approach has the advantage of taking into account the way an ice mixture is grown into the β parameter and extracting a parameter insensitive to experimental procedures. It also underlines the sensitivity of the derived kinetic constants to experimental conditions and the care that needs to be taken to derive a reliable kinetic rate.
4. Astrophysical implications
We have derived the expressions for the kinetic laws and reaction rates of NH4+ OCN− formation from the HNCO + NH3 isolated reaction from experimental kinetic data for temperatures between 8 K and 60 K using a rate equation approach, a Monte Carlo approach and a distribution approach, as summarized in Table 2. Although conceptually very different, the deterministic and the stochastic approaches give similar results given the uncertainties in the fitting procedures and the dispersion of the experimental results. This shows that in ice analogs as well the master equation probabilities can be approximated by rate constants, derived from a simple Arrhenius law. The former approach gives empirically derived rate constants, while the latter approach gives physical insight and explains why the reaction is not complete. We also tried to describe the distribution of HNCO orientation configurations with respect to NH3 using a gamma probability distribution, which gives similar results to the previous approaches.
Whether or not this purely thermal mechanism is relevant to OCN− formation in the interstellar medium is a question, first, of the kinetics of this reaction and of other competing reactions, such as photodissociations or hydrogenations of HNCO at a particular temperature; and second, of the physical environment the ice is located in. Indeed, in different interstellar environments, the grains are subjected to different temperatures, photon fluxes, and density conditions, and solid-state OCN− can be formed or destroyed accordingly. We will discuss the production of OCN− from the HNCO + NH3 reaction first in a dense molecular cloud and then in a YSO, using a gas-grain model.
To take into account the influence of H2O and all competing reactions in a dense molecular cloud, we used a rate equation gas-grain model (Hasegawa et al. 1992) along with the physical parameters used in Hasegawa et al. (1992): hydrogen density N(H) = n(H) + n(H2) = 2 × 104 cm-3, dust-to-gas mass ratio 1%, grain density 3 g cm-3, 0.1 micron grains, surface sites of adsorption 106, a high visual extinction Av = 10, and the initial gas-phase conditions with all hydrogen into its molecular form at the initial time. We used the most recent reactions database for the gas phase (OSU database) and the solid phase (Garrod et al. 2008). The HNCO + H2O and H3O++ OCN− reactions measured in an earlier work (Theule et al. 2011), along with the HNCO + NH3 reaction measured in this work, were added to this reaction network with their measured activation energies. We assumed the Er = 0.4 ± 0.1 kJ mol-1 (48 ± 12 K) activation energy value for the HNCO + NH3 reaction, excluding the slow phenomenon, which is of the same nature as diffusion, so that we did not account for it twice.
The HNCO + H2O and HNCO + NH3 reactions are the only ways of producing solid-state OCN− in the gas-grain models. We have measured that the HNCO + NH3 reaction rate at 10 K, the typical temperature of a molecular cloud, is k(10 K) ≃ 1.8 × 10⁻⁴ s-1. When accounting for the diffusion of HNCO and NH3, following the usual expression for the thermal diffusion of the reactants species on water ice, expressed in Eq. (9) from Hasegawa et al. (1992), this rate decreases to 2 × 10-37 cm-3 s-1. The reaction is therefore very slow, and not efficient enough to counterbalance other reactions such as the hydrogenation of HNCO, as previously noticed in Theule et al. (2011). OCN− is not formed in a typical molecular cloud in 3 × 10⁵ years. Hydrogenation reactions are orders of magnitude faster, and as such dominate solid HNCO surface chemistry. Therefore OCN− cannot be formed in a cold molecular cloud, as confirmed by background star observations (Knez et al. 2005).
We then investigated if OCN− can be formed from the HNCO + NH3 reaction in a YSO. At Tgrain = 40 K, which is a typical temperature in a YSO (van Broekhuizen et al. 2004), and a sufficiently low temperature to encounter water ice and HNCO on a YSO grain, we measured k(40 K) ≃ 1 × 10⁻³ cm-3 s-1 (6 × 10⁻⁴ cm-3 s-1 when corrected from the diffusion). Moreover, because the surface temperature is warmer, the residence time of H on grains is shorter and hydrogenation reactions are not dominant anymore. Then, solid OCN− can reach an important value, approximately 40% with respect to solid H2O in 3 × 10⁵ years. This result is two orders of magnitude above typically observed OCN− quantities in YSOs (van Broekhuizen et al. 2005). This quantitative overestimation can be explained by the poor knowledge we have on how to calculate the diffusion of the reactants, by the uncertainty on the reaction rates in a genuine interstellar ice environment, on the solid HNCO quantity, or by the fact that astronomical ice features are integrated along a line of sight where solid OCN− abundance can fluctuate. However, we can qualitatively account first for the observations of the OCN− ice feature and second for the non-observation of solid-state HNCO in a YSO. Indeed, according to Garrod et al. (2008) solid HNCO is mainly formed from the NH + CO thermal reaction, which has a 4 × 10-12 cm-3 s-1 reaction rate at 40 K and Av = 10, and is therefore very efficient in forming HNCO. This mechanism has been qualitatively confirmed from NH3:CO ices VUV irradiation experiments (Grim et al. 1989). However, solid HNCO abundance is calculated to remain very low, approximately 10-10 with respect to solid H2O, and therefore cannot be detected in infrared spectra. Once formed, HNCO is an intermediate species that reacts very quickly with NH3 to give OCN−, which explains why OCN− is detected, while HNCO is not.
5. Conclusion
We experimentally measured the kinetics of the HNCO + NH3 isolated solid-state reaction in a HNCO:NH3 ice at different temperatures between 8 K and 60 K. We derived the expressions for the kinetic laws and the temperature dependence of the OCN− formation rate using a two-consecutive-step model. The first step is a slow first-order process, where the two reacting molecules are spatially orientating around their center of mass in a configuration that allows the chemical reaction, with a rate ko(T). This orientation process is an experimental artifact because interstellar ice analogs are out of equilibrium amorphous solids. Its barrier is so low that it is influenced by the IR photons of our spectrometer. The second step is a fast first-order process, where the proton is transferred from the HNCO nitrogen atom to the NH3 nitrogen atom with a rate kr(T). We used a deterministic approach based on a rate equation formalism and a stochastic approach based on a kinetic Monte Carlo formalism and on a gamma probability distribution function to derive the reaction rate. The reaction rate follows an Arrhenius law, kr(T) = νr × exp( − Er/RT)) with νr = 0.0035 ± 0.0015 s-1 and Er = 0.4 ± 0.1 kJ mol-1 (48 ± 12 K), between 60 K and 15 K and exhibits a quantum tunneling reaction between 15 K and 8 K with a 2 × 10⁻⁴ s-1 rate independent from the temperature. The three approaches, although conceptually different, give a similar activation energy and pre-exponential factor. This specifically shows that it is equivalent to use a deterministic rate equation approach or a Monte Carlo approach to model a thermal reaction within a macroscopic ice sample. Using the measured reaction rate and a gas-grain model, we qualitatively showed that the HNCO + NH3 reaction is too slow to compete with hydrogenation reactions in a 10 K molecular cloud, while it is fast enough to produce observed OCN− in young stellar object interstellar ices at an average temperature of 40 K without producing observable quantities of HNCO. Achieving a more quantitative agreement to account for the OCN− observations in different astrophysical environments will require a better understanding of how solid-state HNCO is formed and hydrogenated and how the diffusion in H2O dominated ices furthermore limits chemical reaction rates. Indeed, in a real H2O dominated astrophysical ice, H2O is dramatically slowing down the kinetics of the HNCO + NH3 reaction by forcing the reactants to diffuse to meet each other.
Acknowledgments
This work has been founded by the French national program Physique Chimie du Milieu Interstellaire (PCMI) and the Centre National d’Études Spatiales (CNES). P. Theule thanks A. Callegari and A. Mekkaoui for the useful discussions on the statistical distribution of reaction rates and on the gamma probability distribution function. The authors acknowledge the referee for the questions and comments he/she raised, which helped to make this article more understandable.
References
- Bennett, C. J., Jones, B., Knox, E., et al. 2010, ApJ, 723, 641 [NASA ADS] [CrossRef] [Google Scholar]
- Burke, D. J., & Brown, W. A. 2010, Phys. Chem. Chem. Phys., 12, 5947 [NASA ADS] [CrossRef] [PubMed] [Google Scholar]
- Benderskii, V. A., Makarov, D. E., & Wight C. A. 1994, Chemical Dynamics At Low Temperatures (New York: Wiley-interscience), Chap. 8 [Google Scholar]
- Bottinelli, S., Boogert, A. C. A., Bouwman, J., et al. 2010, ApJ, 718, 1100 [NASA ADS] [CrossRef] [Google Scholar]
- Brünken, S., Gottlieb, C. A., McCarthy, M. C., & Thaddeus, P. 2009, ApJ, 697, 880 [NASA ADS] [CrossRef] [Google Scholar]
- Cannizzo, A., Leone, M., Gawelda, W., et al. 2008, Appl. Phys. Lett., 93, 102901 [NASA ADS] [CrossRef] [Google Scholar]
- Chang, Q., Cuppen, H. M., & Herbst, E. 2007, A&A, 469, 973 [NASA ADS] [CrossRef] [EDP Sciences] [Google Scholar]
- Charnley, S. B. 1998, ApJ, 509, L121 [NASA ADS] [CrossRef] [Google Scholar]
- Dartois, E. 2005, Space Sci. Rev., 119, 293 [NASA ADS] [CrossRef] [Google Scholar]
- Demyk, K., Dartois, E., d’Hendecourt, L. B., et al. 1998, A&A, 339, 353 [Google Scholar]
- d’Hendecourt, L. B., & Allamandola, L. J. 1986, A&AS, 64, 453 [NASA ADS] [Google Scholar]
- Garrod, R. T., Weaver, S. L. W., & Herbst, E. 2008, ApJ, 682, 283 [NASA ADS] [CrossRef] [Google Scholar]
- Garrod, R. T., Vasyunin, A. I., Semenov, D. A., Wiebe, D. S., & Henning, T. 2009, ApJ, 700, L43 [Google Scholar]
- George, S. M., & Livingston, F. E. 1997, Surf. Rev. Lett., 4, 771 [CrossRef] [Google Scholar]
- Gillespie, D. T. 1976, J. Comput. Phys., 22, 403 [Google Scholar]
- Grim, R. J. A., & Greenberg, J. M. 1987, ApJ, 321, L91 [NASA ADS] [CrossRef] [Google Scholar]
- Grim, R. J. A., Greenberg, J. M., de Groot, M. S., et al. 1989, A&AS, 78, 161 [NASA ADS] [Google Scholar]
- Hasegawa, T., Herbst, E., & Leung, C. M. 1992, A&AS, 82, 167 [Google Scholar]
- Jansen, A. P. J. 1995, Comp. Phys. Comm., 86, 1 [NASA ADS] [CrossRef] [Google Scholar]
- Johnson, N. L., Kotz, S., & Balakrishnan, N. 1995, Continuous univariate distributions, 2, 2nd edn. (New York: John Wiley) [Google Scholar]
- Kerkhof, O., Schutte, W. A., & Ehrenfreund, P. 1999, A&A, 346, 990 [NASA ADS] [Google Scholar]
- KIDA (KInetic Database for Astrochemistry), http://kida.obs.u-bordeaux1.fr [Google Scholar]
- Knez, C., Boogert, A. C. A., Pontoppidan, K. M., et al. 2005, ApJ, 635, L145 [NASA ADS] [CrossRef] [Google Scholar]
- Lipshtat, A., & Biham, O. 2003, A&A, 400, 585 [NASA ADS] [CrossRef] [EDP Sciences] [Google Scholar]
- Livingston, F. E., Whipple, G. C., & George, S. M. 1997, J. Phys. Chem. B, 101, 6127 [CrossRef] [Google Scholar]
- Lowenthal, M. S., Khanna, R. K., & Moore, M. H. 2000, BAAS, 32, 1108 [NASA ADS] [Google Scholar]
- Mielke, Z., Coussan, S., Mierzwicki, K., Roubin, P., & Saldyka, M. 2006, J. Phys. Chem. A, 110, 4712 [CrossRef] [Google Scholar]
- Mielke, Z., Mucha, M., Bil, A., et al. 2008, Chem. Phys. Chem., 9, 1774 [CrossRef] [Google Scholar]
- Moore, M. H., Donn, B., Khanna, R., & A’Hearn, M. F. 1983, Icarus, 54, 388 [NASA ADS] [CrossRef] [Google Scholar]
- Novozamsky, J. H., Schutte, W. A., & Keane, J. V. 2001, A&A, 379, 588 [NASA ADS] [CrossRef] [EDP Sciences] [Google Scholar]
- OSU astrochemistry database, network 2009 [Google Scholar]
- Park, S. C., Moon, E. S., & Kang, H. 2010, Phys. Chem. Chem. Phys., 12, 12000 [CrossRef] [Google Scholar]
- Raunier, S. S., Chiavassa, T., Allouche, A., Marinelli, F., & Aycard, J.-P. 2003a, Chem. Phys., 288, 197 [NASA ADS] [CrossRef] [Google Scholar]
- Raunier, S., Chiavassa, T., Marinelli, F., Allouche, A., & Aycard, J.-P. 2003b, Chem. Phys. Lett., 368, 594 [NASA ADS] [CrossRef] [Google Scholar]
- Redhead, P. A. 1962, Vacuum, 12, 203 [CrossRef] [Google Scholar]
- Soifer, B. T., Puetter, R. C., Russell, R. W., et al. 1979, ApJ, 232, L53 [NASA ADS] [CrossRef] [Google Scholar]
- Theule, P., Duvernay, F., Ilmane, A., et al. 2011, A&A, 530, A96 [NASA ADS] [CrossRef] [EDP Sciences] [Google Scholar]
- Uzer, T., & Miller, W. H. 1991, Phys. Rep., 199, 73 [NASA ADS] [CrossRef] [Google Scholar]
- van Broekhuizen, F. A., Keane, J. V., & Schutte, W. A. 2004, A&A, 415, 425 [NASA ADS] [CrossRef] [EDP Sciences] [Google Scholar]
- van Broekhuizen, F. A., Pontoppidan, K. M., Fraser, H. J., & van Dishoeck, E. F. 2005, A&A, 441, 249 [NASA ADS] [CrossRef] [EDP Sciences] [Google Scholar]
- Viazovkin, S., & Wight, C. A. 1997, Annu. Rev. Phys. Chem., 48, 125 [NASA ADS] [CrossRef] [PubMed] [Google Scholar]
All Tables
Experimental reaction rates (see text) for the HNCO + NH3 → NH4+ + OCN− chemical reaction as a function of temperature.
All Figures
|
Fig. 1 a) Infrared spectrum of an HNCO:NH3 ice mixture in a 1:20 ratio. OCN− has a band at 2151 cm-1. HNCO has a band at 2259 cm-1 corresponding to HNCO in a NH3 environment. b) Difference spectrum with respect to t = 0 s of the HNCO 2259 cm-1 band at T = 15 K at t = 5300 s, 10 000 s, 21 000 s, and 31 000 s. |
| In the text | |
|
Fig. 2 Time evolution of the normalized HNCO molar fraction recorded by FTIR spectroscopy (full line) at T = 20 K for a HNCO:NH3 mixture where NH3 is largely in excess (1:20 concentration ratio). Fitting the experimental data against the analytical expressions for the HNCO time evolution using a rate equation approach (dashed line), a Monte Carlo approach (dotted-dashed line) and a gamma probability distribution (dotted line) gives the value for the reaction rate at a fixed temperature. The three approaches perfectly fit the experimental HNCO decay curve. |
| In the text | |
|
Fig. 3 ln( |
| In the text | |
|
Fig. 4 Decay curves of x(HNCO)(t) at 8 K, with and without the ice sample irradiated with the FTIR spectrometer beam in between two measures. The FTIR spectrometer clearly has an effect on the slow orientation process, while the fast reaction process is not affected. |
| In the text | |
|
Fig. 5 Chi square surface in grayscale, resulting from a fit of experimental HNCO decay at 20 K as a function of the activation rate kr and HNCO |
| In the text | |
Current usage metrics show cumulative count of Article Views (full-text article views including HTML views, PDF and ePub downloads, according to the available data) and Abstracts Views on Vision4Press platform.
Data correspond to usage on the plateform after 2015. The current usage metrics is available 48-96 hours after online publication and is updated daily on week days.
Initial download of the metrics may take a while.