Fig. 2
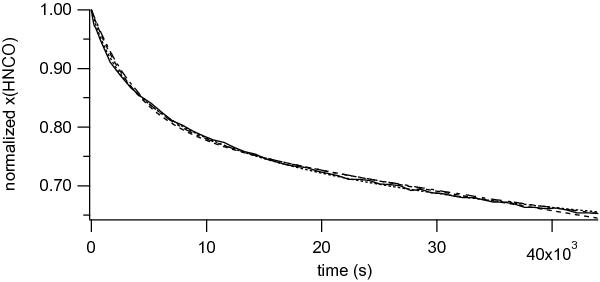
Time evolution of the normalized HNCO molar fraction recorded by FTIR spectroscopy (full line) at T = 20 K for a HNCO:NH3 mixture where NH3 is largely in excess (1:20 concentration ratio). Fitting the experimental data against the analytical expressions for the HNCO time evolution using a rate equation approach (dashed line), a Monte Carlo approach (dotted-dashed line) and a gamma probability distribution (dotted line) gives the value for the reaction rate at a fixed temperature. The three approaches perfectly fit the experimental HNCO decay curve.
Current usage metrics show cumulative count of Article Views (full-text article views including HTML views, PDF and ePub downloads, according to the available data) and Abstracts Views on Vision4Press platform.
Data correspond to usage on the plateform after 2015. The current usage metrics is available 48-96 hours after online publication and is updated daily on week days.
Initial download of the metrics may take a while.