Fig. 3
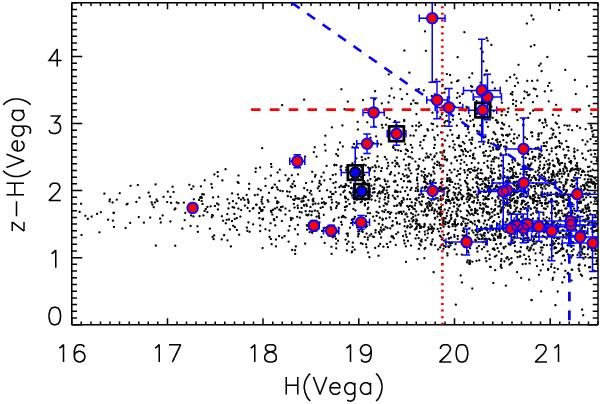
z − H vs. H colour − magnitude diagram for the region encompassing XMMU J0338.7 + 0030 imaged with OMEGA2000. Red filled circles represent galaxies within 45′′ from the X-ray position of the cluster. The blue dashed lines reproduce the 50% completeness of the photometric catalogue extracted from the OMEGA2000 data. The horizontal red short-dashed line represents the z − H colour expected for an SSP model corresponding to the evolutionary phase of an instantaneous burst of star formation observed at z = 5 with Salpeter (1955) stellar IMF and solar metallicity observed at z = 1.45. This SSP model describes the average colour of the seven galaxies associated with XMMU J0338.7 + 0030 that exhibit 2.8 ≤ z − H ≤ 3.8 Vega mag. The vertical red dotted line represents the characteristic magnitude H⋆ at z = 1.45 (from Fassbender et al. 2007). Empty black squares mark the four spectroscopic cluster members that were successively established to be at z = 1.1 through VLT-FORS2 observations (see Fig. 11 and Table 1 in Sect. 2.4.2); blue filled circles highlight those with ID = 12 and ID = 15, which are at a cluster-centric distance greater than 45′′. The two spectroscopic cluster members without convincing evidence of ongoing star-formation activity (with ID = 2 and ID = 16) exhibit about as red z − H colours as the previous SSP model (see Appendix B, however).
Current usage metrics show cumulative count of Article Views (full-text article views including HTML views, PDF and ePub downloads, according to the available data) and Abstracts Views on Vision4Press platform.
Data correspond to usage on the plateform after 2015. The current usage metrics is available 48-96 hours after online publication and is updated daily on week days.
Initial download of the metrics may take a while.