Fig. 9
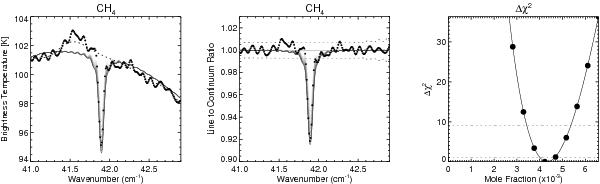
Testing the line-by-line forward model by fitting the CH4 rotational line. The left hand panel shows the brightness temperatures, with the data given by circles, the smooth spline-fit to the continuum as the dotted line, and the solid grey lines showing the range of mole fractions tested. The central panel converts this to a line-to-continuum ratio relative to the smooth spline. Here, the dotted lines show the error envelope as defined in the main text. The right hand panel shows the Δχ2 for the model, with dotted horizontal lines showing the 1σ and 3σ confidence limits on the results. The derived methane abundance depends upon the choice of line data, with a mole fraction of (4.3 ± 0.3) × 10-3 assuming line intensities from Wishnow et al. (2007) (shown here) and (4.8 ± 0.3) × 10-3 using intensities from Boudon et al. (2010).
Current usage metrics show cumulative count of Article Views (full-text article views including HTML views, PDF and ePub downloads, according to the available data) and Abstracts Views on Vision4Press platform.
Data correspond to usage on the plateform after 2015. The current usage metrics is available 48-96 hours after online publication and is updated daily on week days.
Initial download of the metrics may take a while.