Fig. 6
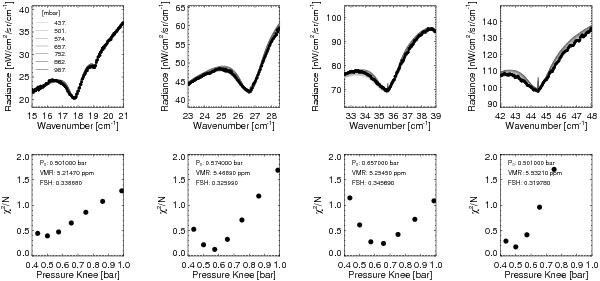
Testing the sensitivity to the pressure knee of the PH3 vertical distribution. The pressure levels (in mbar) are given by the key in the top left corner, but the differences between these curves is hard to distinguish in the top four panels, showing the difficulty we face in trying to constrain the pressure knee from these data. The χ2 / N distributions in the bottom panels show convergence on the 500–650 mbar range. The χ2 estimates do not include the spurious emission peaks from the models (see main text and Fig. 7). The best fitting pressure knee, deep mole fraction and fractional scale height are provided in the lower panels.
Current usage metrics show cumulative count of Article Views (full-text article views including HTML views, PDF and ePub downloads, according to the available data) and Abstracts Views on Vision4Press platform.
Data correspond to usage on the plateform after 2015. The current usage metrics is available 48-96 hours after online publication and is updated daily on week days.
Initial download of the metrics may take a while.