Fig. 5
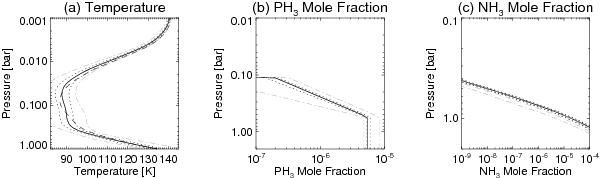
Retrieved vertical profiles for temperature, PH3 and NH3 in the best-fitting case. The solid line shows the retrieved profile, the dotted line is the uncertainty on the retrieval, estimated by applying a 5% shift in the measured radiances (the absolute calibration uncertainty) and redoing the calculation. The dashed line in the temperature plot a) is a global mean of the T(p) profiles retrieved from the Cassini/CIRS far-infrared focal plane between 2004 and 2008. The dot-dashed grey lines in a) and b) are temperature and PH3 retrievals based on extreme estimates of the calibration uncertainty of ±15%. The NH3 profile in c) was estimated by scaling the saturated vapour pressure profile (see Fig. 8), so the uncertainties are the same at all altitudes. The grey dashed line in c) is the saturated vapour pressure curve of NH3 assuming a relative humidity of 100%, the dot-dashed grey line use the temperature profiles given by the dotted lines in a). The uncertainty in the saturated mole fraction is greater than the uncertainty on the retrieved abundances of NH3.
Current usage metrics show cumulative count of Article Views (full-text article views including HTML views, PDF and ePub downloads, according to the available data) and Abstracts Views on Vision4Press platform.
Data correspond to usage on the plateform after 2015. The current usage metrics is available 48-96 hours after online publication and is updated daily on week days.
Initial download of the metrics may take a while.