Fig. 3
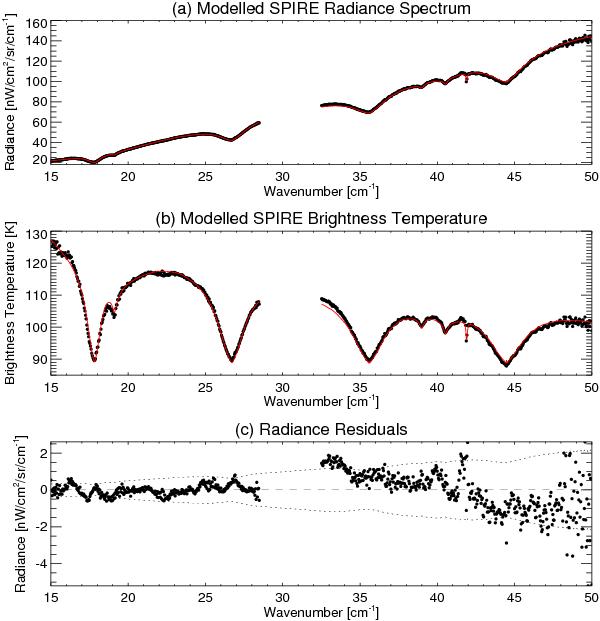
Optimal estimation fitting of the SPIRE continuum using a retrieval algorithm (Irwin et al. 2008). Data are shown as black circles, the fit is the continuous line. Radiances in panel a) are converted to brightness temperatures in b), and the residual (black dots) is shown in panel c). The dotted line in c) shows the radiance uncertainty on the SPIRE data, the dashed line shows the zero line.
Current usage metrics show cumulative count of Article Views (full-text article views including HTML views, PDF and ePub downloads, according to the available data) and Abstracts Views on Vision4Press platform.
Data correspond to usage on the plateform after 2015. The current usage metrics is available 48-96 hours after online publication and is updated daily on week days.
Initial download of the metrics may take a while.