Fig. 11
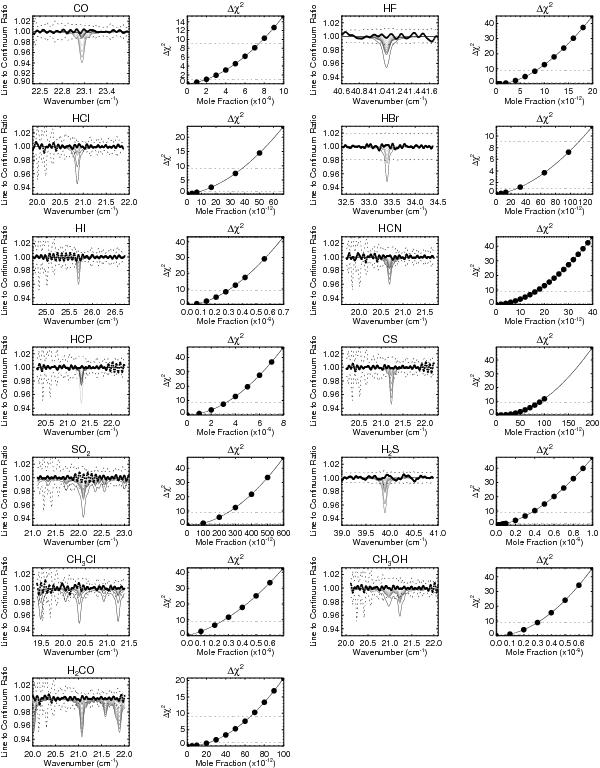
Derivations of upper limits on Saturn’s trace gases in the well-mixed case. For all thirteen gases, the left panel shows the line to continuum ratio in the data (circles) compared to a number of models (grey solid lines), and the right panel shows the degradation of the χ2 parameter as we increase the mole fraction. Dashed lines show the 1σ and 3σ confidence limits. For some species we show only the line which provided the best constraints on the upper limit.
Current usage metrics show cumulative count of Article Views (full-text article views including HTML views, PDF and ePub downloads, according to the available data) and Abstracts Views on Vision4Press platform.
Data correspond to usage on the plateform after 2015. The current usage metrics is available 48-96 hours after online publication and is updated daily on week days.
Initial download of the metrics may take a while.