Fig. 10
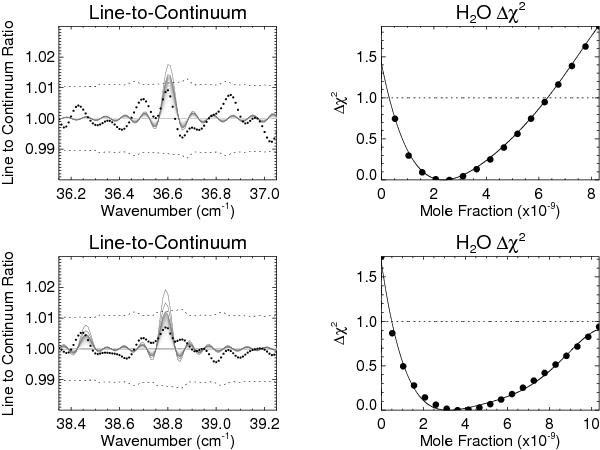
Marginal detection of two emission features of H2O at 36.6 and 38.8 cm-1 (1097 and 1163 GHz, respectively). The best-fitting mole fractions are  and
and  at 0.5 mbar, for each respective line. The left panels show line to continuum ratios for models computed by scaling the photochemical profile of Moses et al. (2000b), with the resulting Δχ2 for each model shown on the right. The dotted lines in the left panels show the conservative error envelope as defined in the main text, the black circles are the SPIRE data. The right hand panel shows the Δχ2 for each model, with dotted horizontal lines showing the 1σ confidence limits on the results.
Current usage metrics show cumulative count of Article Views (full-text article views including HTML views, PDF and ePub downloads, according to the available data) and Abstracts Views on Vision4Press platform.
Data correspond to usage on the plateform after 2015. The current usage metrics is available 48-96 hours after online publication and is updated daily on week days.
Initial download of the metrics may take a while.