Fig. 4
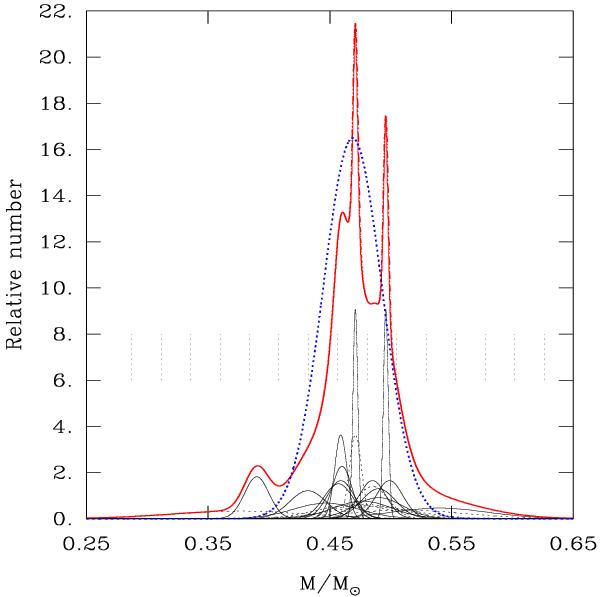
Raw mass distribution of sdB stars (red curve) obtained by adding together 22 Gaussians, each representing a measurement defined by a mass value and its associated 1σ uncertainty. The individual Gaussians are shown in black; as solid curves for the 15 pulsators, and dotted curves for the seven objects culled from Table 2. The area under each individual Gaussian is normalized to the same value so as to correspond to the contribution of 1 star. The ordinate is on an arbitrary scale. The blue dotted curve shows the normal distribution characterized by μ = 0.4687 M⊙ and σ = 0.0242 M⊙. It is normalized in such a way as to have the same area under its curve as the raw distribution, corresponding to a total number of 22 objects. The dotted vertical line segments are used in the eventual conversion of the raw distribution (red curve) into the form of an histogram (see text).
Current usage metrics show cumulative count of Article Views (full-text article views including HTML views, PDF and ePub downloads, according to the available data) and Abstracts Views on Vision4Press platform.
Data correspond to usage on the plateform after 2015. The current usage metrics is available 48-96 hours after online publication and is updated daily on week days.
Initial download of the metrics may take a while.