Fig. 3
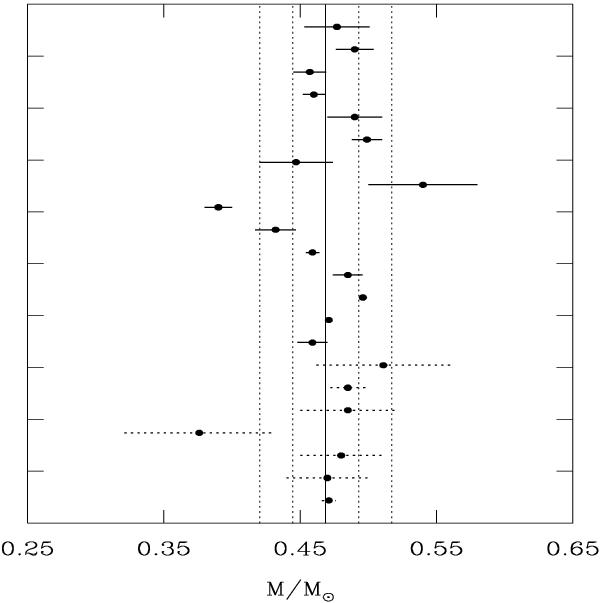
Measured masses of sdB stars. The error bars indicate the ± 1σ uncertainties. The 15 stars culled from our asteroseismological sample are shown by solid error bars, while the seven objects taken from Table 2 are shown by dotted error bars. The solid vertical line illustrates the peak value of the likelihood function for our full sample of 22 stars, μ = 0.4687 M⊙, while the accompanying two sets of dotted vertical lines define the central 68.3% (inner lines) and 95.4% (outer lines) probability intervals associated with the assumed model normal distribution.
Current usage metrics show cumulative count of Article Views (full-text article views including HTML views, PDF and ePub downloads, according to the available data) and Abstracts Views on Vision4Press platform.
Data correspond to usage on the plateform after 2015. The current usage metrics is available 48-96 hours after online publication and is updated daily on week days.
Initial download of the metrics may take a while.