Free Access
Fig. 7
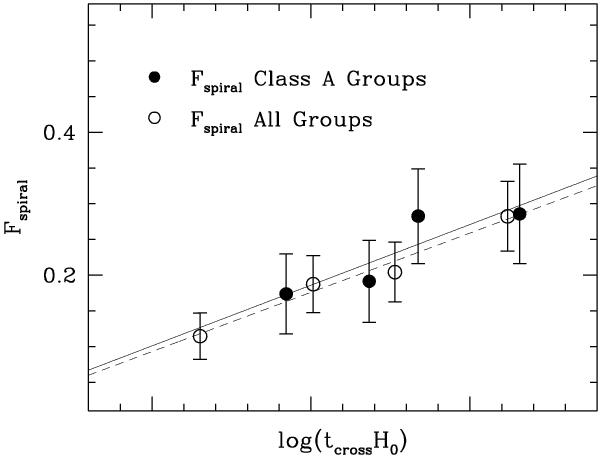
Spectroscopically selected fraction of spiral galaxies as a function of the crossing time for all spectroscopically confirmed groups and for the class A groups only. The solid and dashed lines represent the fits for the class A groups and the whole sample, respectively.
Current usage metrics show cumulative count of Article Views (full-text article views including HTML views, PDF and ePub downloads, according to the available data) and Abstracts Views on Vision4Press platform.
Data correspond to usage on the plateform after 2015. The current usage metrics is available 48-96 hours after online publication and is updated daily on week days.
Initial download of the metrics may take a while.