Fig. 9

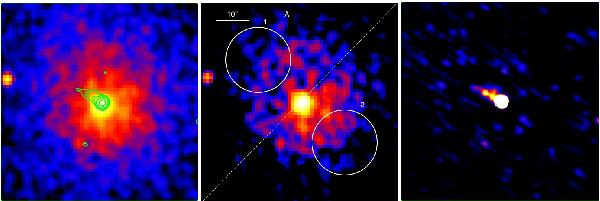
(Left) Chandra full-band image with VLA radio contours overlaid in green. (Middle) Residual Chandra soft-band image after subtraction of the best-fit single β-model. A lack of X-ray emission is observed in sector A with respect to the average surface brightness. This asymmetry is quantified by comparing the average emission in the circular regions labeled 1 and 2 (see text). (Right) VLA image of the radio source coincident with the cluster core. A pronounced extended feature with an extent of 80 kpc is seen in the NW direction. All images have a size of 1′ × 1′. The Chandra images are shown in logarithmic scale with a Gaussian smoothing of 2″.
Current usage metrics show cumulative count of Article Views (full-text article views including HTML views, PDF and ePub downloads, according to the available data) and Abstracts Views on Vision4Press platform.
Data correspond to usage on the plateform after 2015. The current usage metrics is available 48-96 hours after online publication and is updated daily on week days.
Initial download of the metrics may take a while.


