Fig. 5
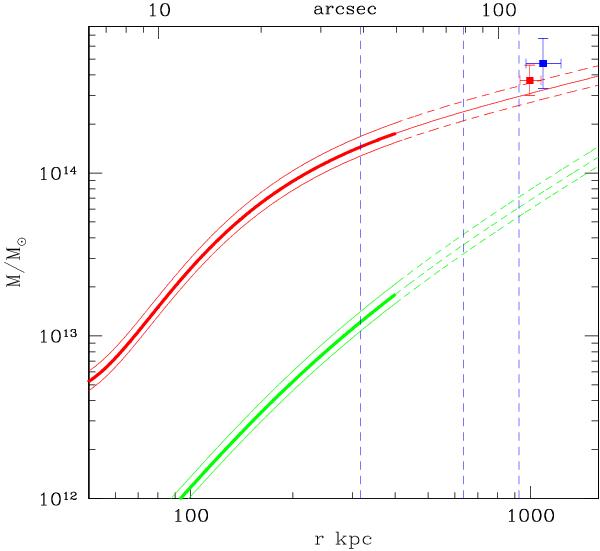
Total mass for WARPJ1415 from hydrodynamical equilibrium (red continuous line) and gas mass (green dashed line). The two dashed lines above and below the total mass profile show the 1σ confidence interval. The profiles are shown with thick lines up to 400 kpc. Thin lines at r > 400 kpc show the extrapolation beyond the X-ray detectable emission. Dashed vertical lines corresponds to R2500, R500 and R200, from left to right. The red data point refers to the mass derived with the global cluster temperature, whereas the blue point corresponds to the weak lensing mass (Jee et al. 2011).
Current usage metrics show cumulative count of Article Views (full-text article views including HTML views, PDF and ePub downloads, according to the available data) and Abstracts Views on Vision4Press platform.
Data correspond to usage on the plateform after 2015. The current usage metrics is available 48-96 hours after online publication and is updated daily on week days.
Initial download of the metrics may take a while.