Fig. 2
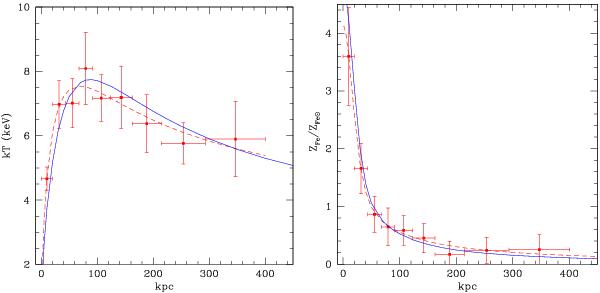
Left panel: observed projected temperature profile of WARP1415 (red points) and the corresponding fit (red dashed line) compared to the deprojected measured temperature values (blue solid line). Right panel: same as left panel for the iron abundance profile. The 68% uncertainty in the fitted curves is very close to the typical error bars of the measured projected quantities at similar radii, and it is not shown for the sake of clarity.
Current usage metrics show cumulative count of Article Views (full-text article views including HTML views, PDF and ePub downloads, according to the available data) and Abstracts Views on Vision4Press platform.
Data correspond to usage on the plateform after 2015. The current usage metrics is available 48-96 hours after online publication and is updated daily on week days.
Initial download of the metrics may take a while.