Fig. 15
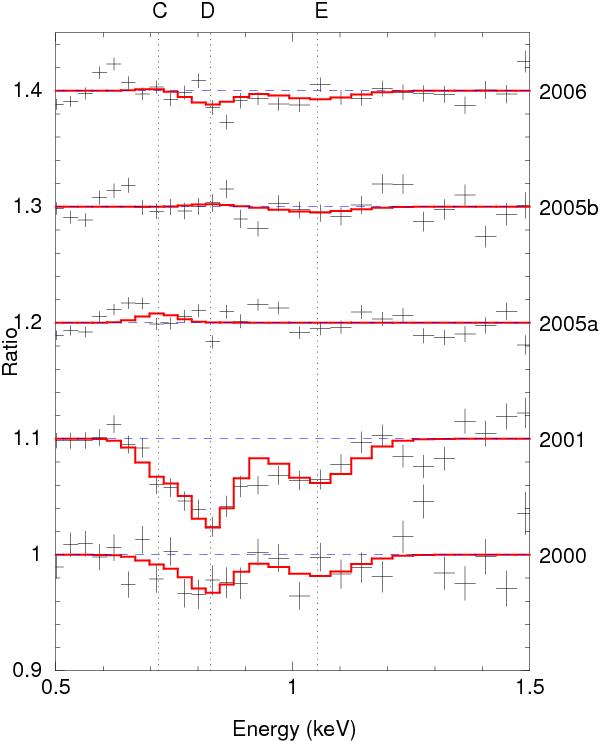
Observed ratios of the fluxed pn spectra of Mrk 509 taken between 2000 and 2006 to the stacked spectrum taken in 2009, in the 0.5–1.5 keV band. As described in the text, a local power-law approximation to the continuum ratios has been taken out. Dotted vertical lines indicate the centroids for three Gaussian components (Table 2) that represent the expected changes of the transmission associated to the ionising flux differences. The solid curves indicate the best-fit sum of three Gaussians to the residuals. For clarity of display, the curves for each spectrum have been shifted along the y-axis by multiples of 0.1.
Current usage metrics show cumulative count of Article Views (full-text article views including HTML views, PDF and ePub downloads, according to the available data) and Abstracts Views on Vision4Press platform.
Data correspond to usage on the plateform after 2015. The current usage metrics is available 48-96 hours after online publication and is updated daily on week days.
Initial download of the metrics may take a while.