Fig. 8
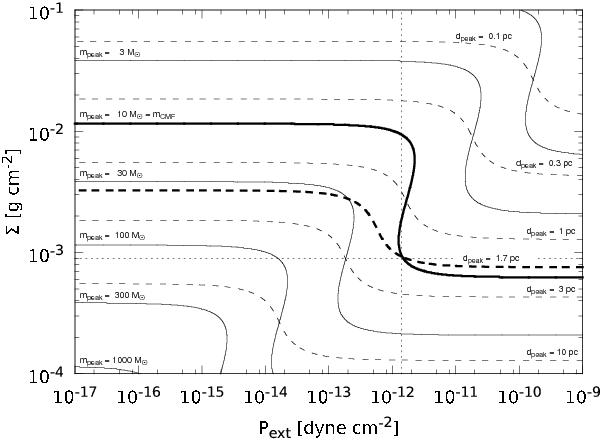
Maximum of the mass spectrum, mpeak, (solid isolines) and the typical fragment separation, dpeak, (dashed isolines) given by PAGI as a function of the shell surface density Σ and the external pressure  . The thick lines show the maximum of the CMF, mCMF, and typical separation of clumps, dMST, obtained from our 13CO APEX observations. The thin dotted lines show the mCMF – dMST intersection at Σ = 9 × 10⁻⁴ g cm-2 and PEXT = 1.4 × 10⁻¹² dyne cm-2.
Current usage metrics show cumulative count of Article Views (full-text article views including HTML views, PDF and ePub downloads, according to the available data) and Abstracts Views on Vision4Press platform.
Data correspond to usage on the plateform after 2015. The current usage metrics is available 48-96 hours after online publication and is updated daily on week days.
Initial download of the metrics may take a while.