Fig. 6
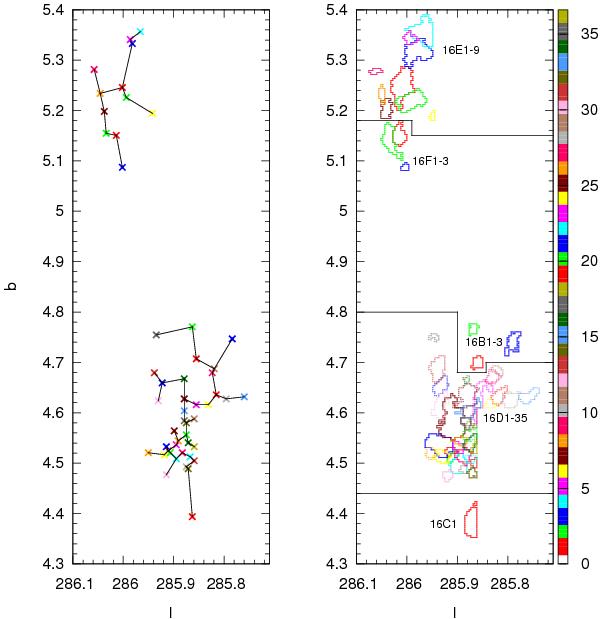
Left: minimum spanning trees showing projected distances between clumps. The two trees are constructed separately in the upper and in the lower observed region. Each tree node (denoted by the × symbol) is at the position of the pixel with the highest brightness temperatures in a given clump (Tpeak). Right: outlines of the 13CO clumps projected onto the lb-plane. Colors and line types correspond to those in Figs. 2–4 and B.1–B.5.
Current usage metrics show cumulative count of Article Views (full-text article views including HTML views, PDF and ePub downloads, according to the available data) and Abstracts Views on Vision4Press platform.
Data correspond to usage on the plateform after 2015. The current usage metrics is available 48-96 hours after online publication and is updated daily on week days.
Initial download of the metrics may take a while.