Fig. 5
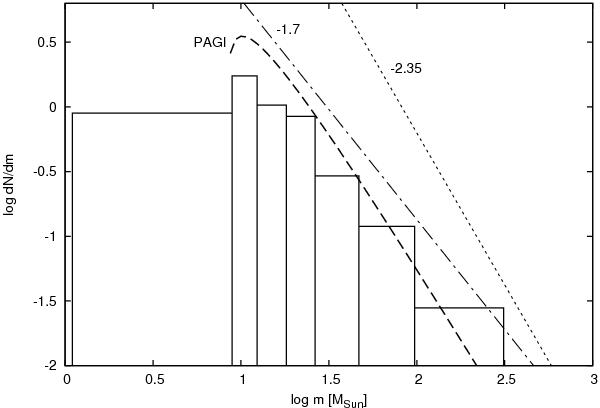
Mass spectrum of fragments identified in our 13CO(J = 2–1) observations (solid line). Following the prescription of Maíz Apellániz & Úbeda (2005) to minimize errors in histograms with a small number of objects, we set bin widths so that each bin includes approximately the same number of objects (six or seven). The dashed line shows the mass spectrum calculated from the PAGI dispersion relation (see Eq. (12)) for Σ = 9 × 10⁻⁴ g cm-2, T = 15 K and PEXT = 1.4 × 10⁻¹² dyne cm-2 (parameters determined in Sect. 5.4). Dash-dotted and dotted lines show power law with slopes −1.7 and −2.35, respectively.
Current usage metrics show cumulative count of Article Views (full-text article views including HTML views, PDF and ePub downloads, according to the available data) and Abstracts Views on Vision4Press platform.
Data correspond to usage on the plateform after 2015. The current usage metrics is available 48-96 hours after online publication and is updated daily on week days.
Initial download of the metrics may take a while.