Fig. 2
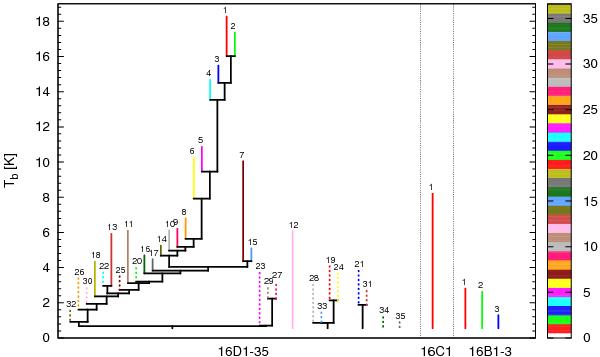
Dendrogram of the clumps in the 13CO(J = 2–1) emission in the lower region. Colors of lines representing clumps are the same as colors of regions showing clumps in Figs. 4 and B.1–B.3. Solid lines and filled regions (in Figs. 4 and B.1–B.3) show clumps 16D1–18, 16C1 and 16B1–3, dashed lines and dotted regions (in Figs. 4 and B.1–B.3) show clumps 16D19–35 (see beginning of Sect. 4 for the nomenclature definition).
Current usage metrics show cumulative count of Article Views (full-text article views including HTML views, PDF and ePub downloads, according to the available data) and Abstracts Views on Vision4Press platform.
Data correspond to usage on the plateform after 2015. The current usage metrics is available 48-96 hours after online publication and is updated daily on week days.
Initial download of the metrics may take a while.