Fig. 8
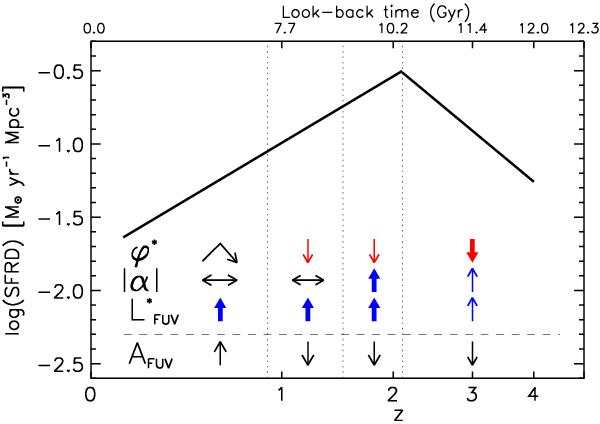
Scheme of the total dust-corrected SFRD as a function of redshift, as found in this work (solid broken line, see Sect. 5.2). We distinguish four epochs, separated with vertical dotted lines. At each epoch, arrows indicate the behaviour of the three Schechter parameters and AFUV: arrows pointing up mean that the parameter is increasing with increasing redshift, arrows pointing down mean that the parameter is decreasing. Red arrows indicate trends that in principle should decrease the total SFRD, the opposite is for blue arrows. Thick arrows indicate which parameter is driving the SFRD evolution at that given epoch. In this raw scheme, we neither consider AFUV dominating, nor making increase or decrease the SFRD: clearly, its trend enhances or weakens the behaviour of the LD when it is transformed to dust-corrected SFRD, but the peak at z ~ 2 is already found in the LD.
Current usage metrics show cumulative count of Article Views (full-text article views including HTML views, PDF and ePub downloads, according to the available data) and Abstracts Views on Vision4Press platform.
Data correspond to usage on the plateform after 2015. The current usage metrics is available 48-96 hours after online publication and is updated daily on week days.
Initial download of the metrics may take a while.