Fig. 7
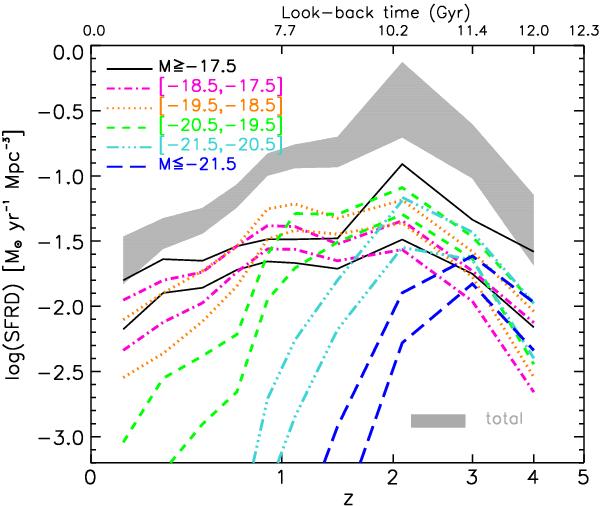
As in Fig. 6, but this time galaxies are divided in narrow luminosity bins, as indicated in the labels. The first and last bins are actually the extremes of the luminosity distribution (the faintest and the brightest galaxies). Also in this case, as in Fig. 6, the errors include all sources of uncertainty. The two lines for each luminosity bin define the region of ± 1-σ error. Not to crowd the plot, as the plotted quantities have larger error bars than in Fig. 6, here we do not distinguish when the luminosity bin considered is fainter or brighter than the LF bias. This can be inferred by Fig. 6.
Current usage metrics show cumulative count of Article Views (full-text article views including HTML views, PDF and ePub downloads, according to the available data) and Abstracts Views on Vision4Press platform.
Data correspond to usage on the plateform after 2015. The current usage metrics is available 48-96 hours after online publication and is updated daily on week days.
Initial download of the metrics may take a while.