Fig. 3
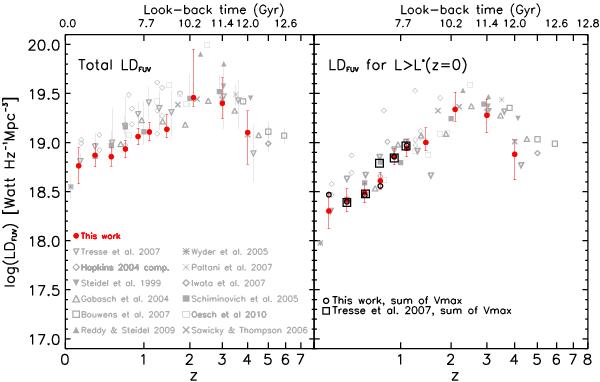
Left panel. VVDS Deep+Ultra-Deep FUV-band luminosity densities derived from our best LF determination (FUV-150 red filled circles) as a function of redshift. Error bars are explained in Sect. 4. Gray data points are ultraviolet LF estimates found in the literature, as detailed in the labels (see also at the end of the caption). Right panel. FUV-band luminosity densities restricted to galaxies brighter than L∗ at z = 0 in Wyder et al. (2005) (MFUV = −18.12). Symbols are like in the left panel. Black open circles and squares represent the LD down to MFUV = −18.12 summing the 1 / Vmax points in this work and in Tresse et al. (2007), respectively, instead of integrating the Schechter LF fit. We did this only up to z ~ 1 because in VVDS data at z ≳ 1 the bias limit for 1 / Vmax computation is brighter than MFUV = −18.12. List of references: Tresse et al. (2007) (VVDS Deep, FUV-150, empty upside-down triangles); compilation of FUV and NUV data extracted from Hopkins (2004) (thin open diamonds); Steidel et al. (1999) (FUV-1700, filled upside-down triangles); Schiminovich et al. (2005) (FUV-150, filled squares those at z < 1.2 GALEX-VVDS for z < 1.2 data); Bouwens et al. (2007) (FUV-1600, thick open squares); Reddy & Steidel (2009) (FUV-1700, filled triangles); Wyder et al. (2005) (GALEX-2dFGRS, FUV-150, thick asterisk); Paltani et al. (2007) (FUV-1700, thin asterisk); Iwata et al. (2007) (FUV-1700, thick open diamonds); Gabasch et al. (2004) (FUV-150, open triangles); Oesch et al. (2010) (FUV-150, thin open squares); Sawicki & Thompson (2006) (FUV-1700, crosses).
Current usage metrics show cumulative count of Article Views (full-text article views including HTML views, PDF and ePub downloads, according to the available data) and Abstracts Views on Vision4Press platform.
Data correspond to usage on the plateform after 2015. The current usage metrics is available 48-96 hours after online publication and is updated daily on week days.
Initial download of the metrics may take a while.