Fig. B.2
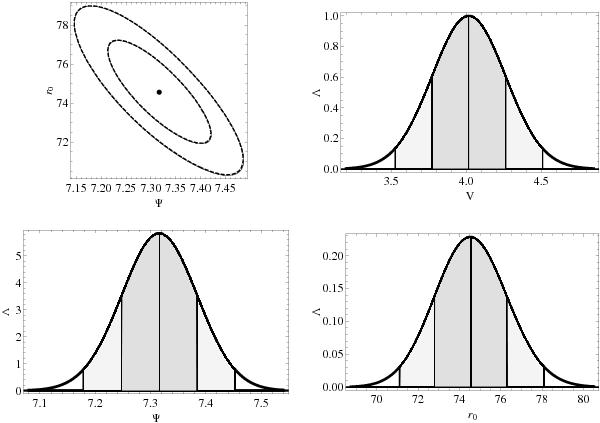
Confidence regions and confidence intervals on NGC 6121 King model parameters. The top left figure shows the overlap of the confidence regions, corresponding to confidence levels of 68.3% and 95.4% (solid lines), and the curves of constant χ2 (dashed lines); the black dot marks the position of the maximum of the likelihood (that is the minimum of χ2). The top right figure shows the confidence intervals for the likelihood depending on V; the bottom figures show the confidence intervals on the parameter Ψ and r0; the dark grey area corresponds to the confidence level of 68.3%, the light grey area to the confidence level of 95.4%; a solid vertical line marks the position of the maximum of the likelihood (that is the minimum of χ2).
Current usage metrics show cumulative count of Article Views (full-text article views including HTML views, PDF and ePub downloads, according to the available data) and Abstracts Views on Vision4Press platform.
Data correspond to usage on the plateform after 2015. The current usage metrics is available 48-96 hours after online publication and is updated daily on week days.
Initial download of the metrics may take a while.