Fig. 1
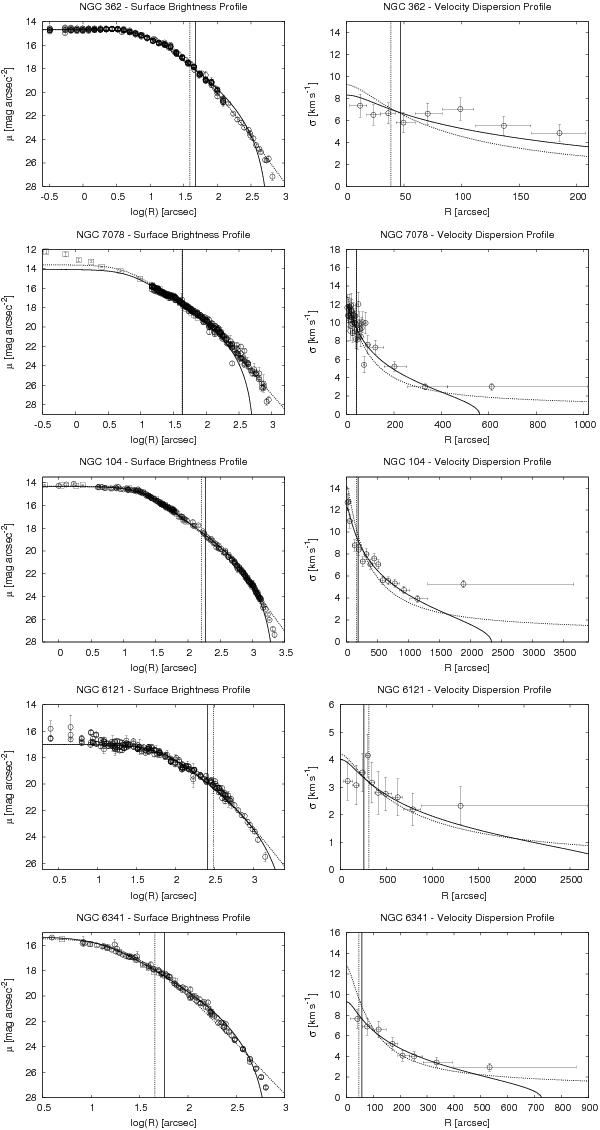
Fits by King models and anisotropic f(ν) models to the surface brightness profiles and to the line-of-sight velocity dispersion profiles of relaxed globular clusters. In all panels, solid lines correspond to the King-model fits, dotted lines to f(ν)-model fits; the vertical solid line marks the position of the King model projected half-light radius, Re, the dotted one the position of the f(ν) model projected half-light radius, Re. For the surface brightness profiles, the data from Trager et al. (1995) are indicated with circles, the data from other sources (see Sect. 3.1) with squares. For each data-point, errors are shown as vertical error bars; in the case of the velocity dispersion profile, the horizontal bars indicate the length of the radial bin in which the data-points have been calculated and have no role in the fitting procedure (see Appendix B).
Current usage metrics show cumulative count of Article Views (full-text article views including HTML views, PDF and ePub downloads, according to the available data) and Abstracts Views on Vision4Press platform.
Data correspond to usage on the plateform after 2015. The current usage metrics is available 48-96 hours after online publication and is updated daily on week days.
Initial download of the metrics may take a while.