Fig. 7
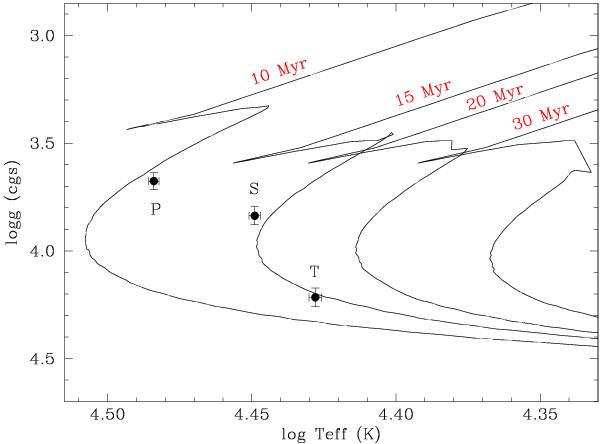
Comparison of the log Teff-log g plane between the observed values for the components of SZ Cam and the theoretical isochrones of the Geneva group (Meynet et al. 1993), which include the effect of stellar rotation and mass loss. Labels P, S, and T mark the primary, secondary and tertiary components respectively. The size of the error bars corresponds to the formal errors of the orbital solution in Table 5.
Current usage metrics show cumulative count of Article Views (full-text article views including HTML views, PDF and ePub downloads, according to the available data) and Abstracts Views on Vision4Press platform.
Data correspond to usage on the plateform after 2015. The current usage metrics is available 48-96 hours after online publication and is updated daily on week days.
Initial download of the metrics may take a while.