Free Access
Fig. 4
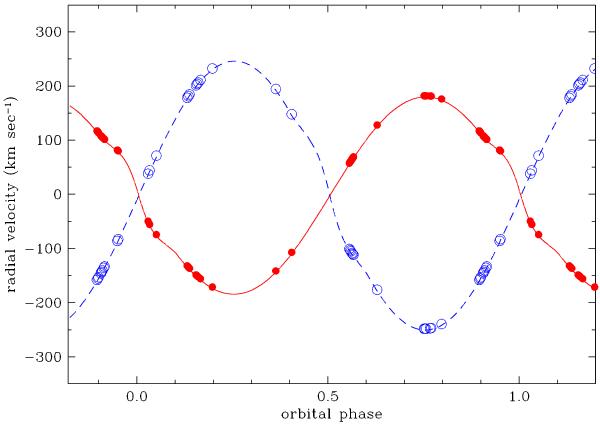
The position in phase of the spectroscopic data used in the disentangling is overplotted on the radial velocity curves from the orbital solution of Table 5. Filled red circles mark the hotter and more massive (primary) star, and the open blue circles the cooler and less massive (secondary) star.
Current usage metrics show cumulative count of Article Views (full-text article views including HTML views, PDF and ePub downloads, according to the available data) and Abstracts Views on Vision4Press platform.
Data correspond to usage on the plateform after 2015. The current usage metrics is available 48-96 hours after online publication and is updated daily on week days.
Initial download of the metrics may take a while.