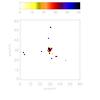
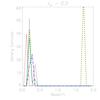
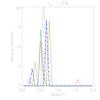
Fig. 8
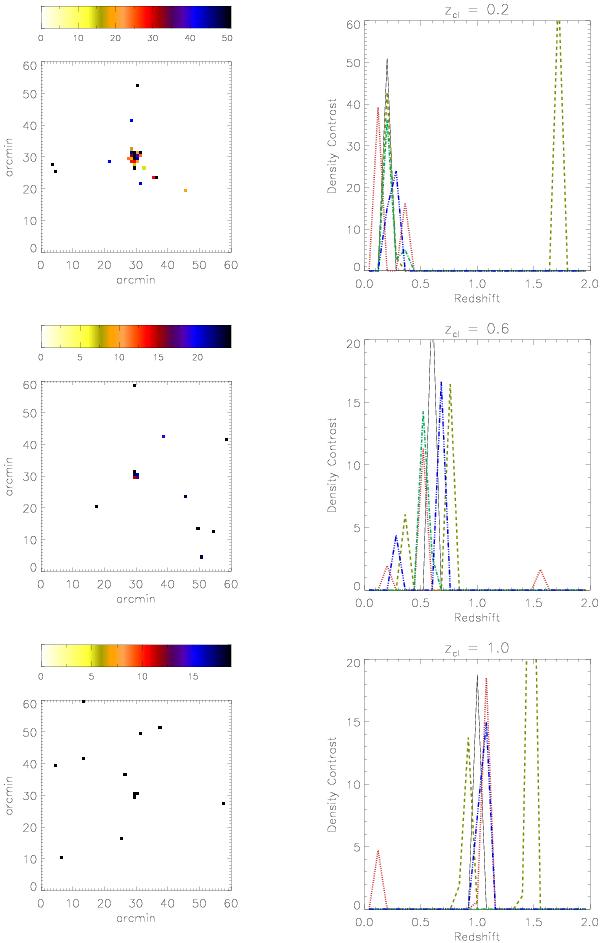
Reconstructions of single clusters located at a redshift of zcl = 0.2 (top row), zcl = 0.6 (middle row) and zcl = 1.0 (bottom row). As before, the left column shows the two-dimensional integrated projection of the reconstruction, while the right panel shows the input density contrast along the line of sight (solid line) and the 1D reconstruction along each of the four central lines of sight (dashed lines).
Current usage metrics show cumulative count of Article Views (full-text article views including HTML views, PDF and ePub downloads, according to the available data) and Abstracts Views on Vision4Press platform.
Data correspond to usage on the plateform after 2015. The current usage metrics is available 48-96 hours after online publication and is updated daily on week days.
Initial download of the metrics may take a while.