Free Access
Fig. 7
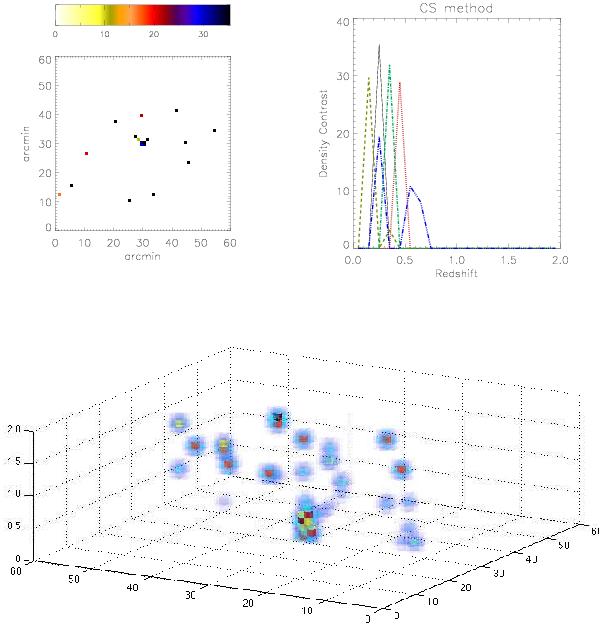
Reconstructions of a cluster at reshift z = 0.25 using noisy data with ng = 30 galaxies per square arcminute. Shown above are the 2D projection of the reconstruction (top left), 1D line of sight plots for the four central lines of sight (top right) and smoothed 3D rendering of the reconstruction, as before.
This figure is made of several images, please see below:
Current usage metrics show cumulative count of Article Views (full-text article views including HTML views, PDF and ePub downloads, according to the available data) and Abstracts Views on Vision4Press platform.
Data correspond to usage on the plateform after 2015. The current usage metrics is available 48-96 hours after online publication and is updated daily on week days.
Initial download of the metrics may take a while.