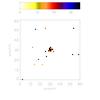
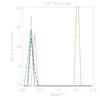
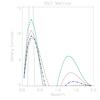
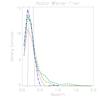
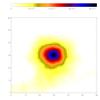
Fig. 5
Comparison of our method with the linear methods as labelled. The left column shows the 2D projection of the reconstruction, while the right column shows the 1D reconstructions along the four central lines of sight (dashed lines). Note that, owing to the amplitude damping effect in SVD and Wiener reconstructions, the y-axis scaling is different in each of the line-of-sight plots.
Current usage metrics show cumulative count of Article Views (full-text article views including HTML views, PDF and ePub downloads, according to the available data) and Abstracts Views on Vision4Press platform.
Data correspond to usage on the plateform after 2015. The current usage metrics is available 48-96 hours after online publication and is updated daily on week days.
Initial download of the metrics may take a while.